You can't estimate a prompt
Story points ran on self-estimates. When you're one prompt away from a working feature, what exactly are you estimating? Most teams already dropped them.
Measure engineering before and after AI. Then tie the speed to the roadmap, and the roadmap to revenue.
Trusted by engineering teams


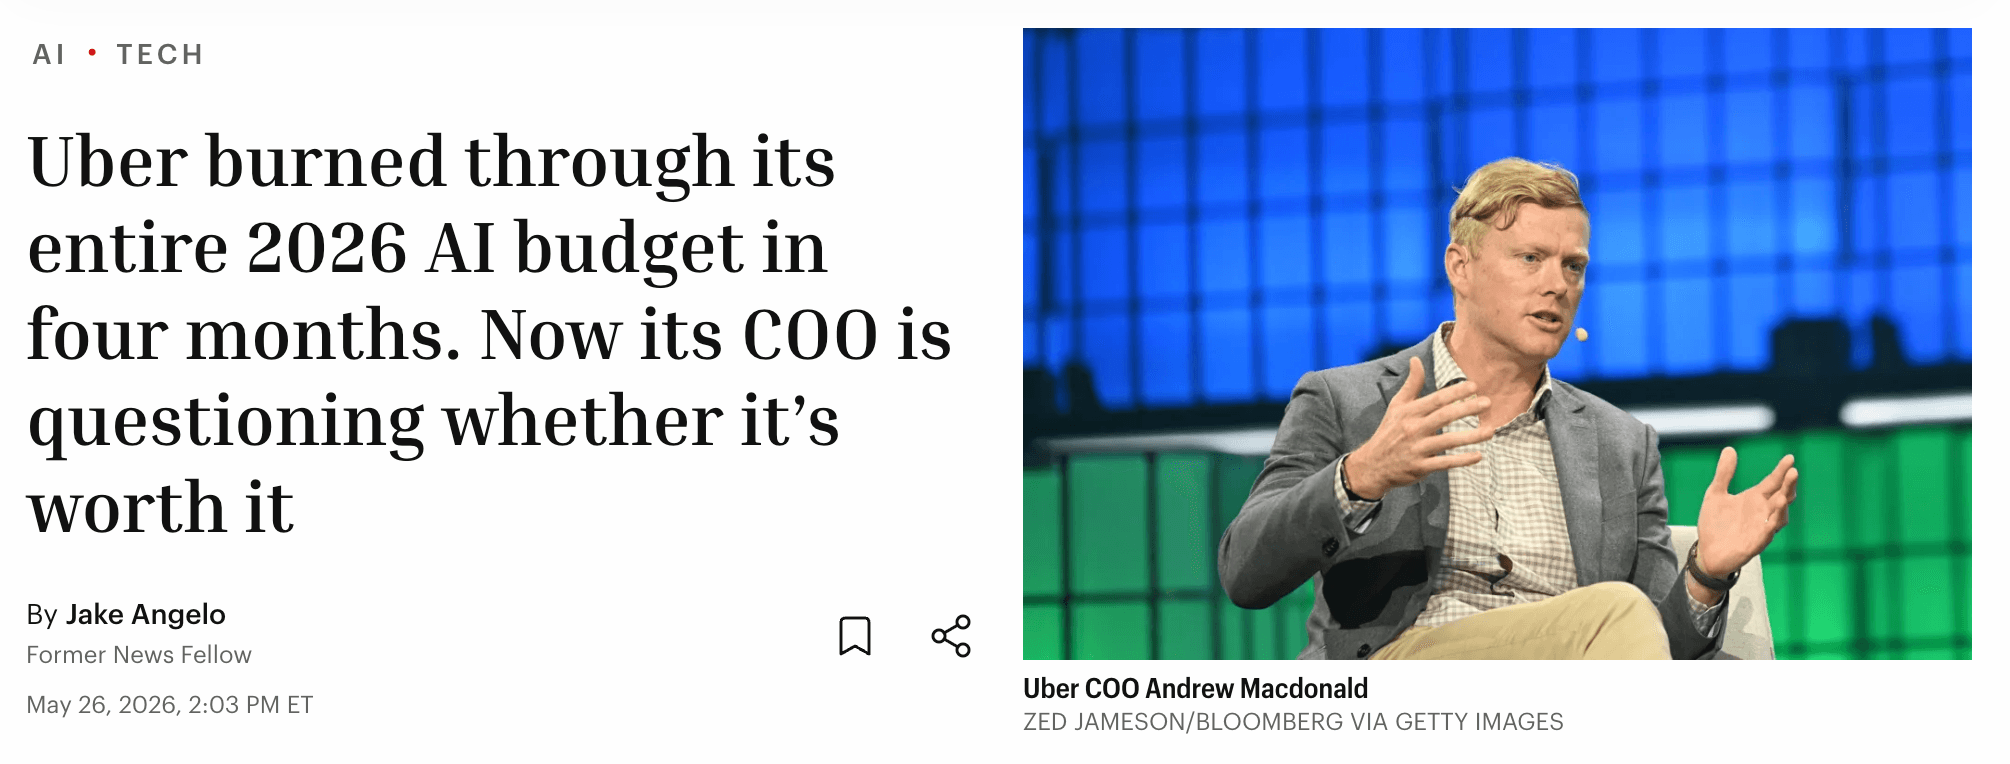
Uber’s entire 2026 AI coding budget, gone. Nothing shippable to show for it.
“That link is not there yet.”
More tokens. More spend. No stat that proves anything reached a customer.
If a KPI for engineering existed, you’d already be using it to prove AI tooling ROI.
Story points ran on self-estimates. When you're one prompt away from a working feature, what exactly are you estimating? Most teams already dropped them.
The pitch for AI tools is "make engineering faster." Faster at what? Coding, reviewing, lines generated? None of that reaches a customer.
You can’t tie engineering straight to revenue. As a former CTO, I got tired of guessing at that gap. So measure the next best thing: your roadmap delivery.
Scored straight from commit history by LLMs, ML, and algorithms, through the lens of a senior engineer. It exists to do two things vibe-based reporting can’t.
Performance, normalized for headcount, against the year before AI. Here it’s up 128% while the team grew far less.
No surveys, no self-report, no story points. One unbiased read of what the code actually shows.
The first three are the math. The fourth is the one teams skip.
No estimates. Real performance now against the year before AI. Every team is faster, and the gain is never uniform.
80% means nothing until you know the category. Bug fixes? Maintaining AI slop? Or actual features?
The test:good adoption keeps the bug and maintenance share flat. If those buckets balloon, you’re paying the tools to clean up after the tools.
Maintenance dropped 10 points. Growth rose.
Read it as a unit price. Cheap per ETV means the spend is working. Expensive per ETV means it isn’t.
Was any of this on the roadmap? Or did the team finally build the thing they always wanted to, now that they can? Connect ETV to Jira and you can see it.
45% unaligned isn’t automatically bad. But look at what they’re building. Usually it’s a process problem, not a people problem.
Key objectives rank by delivered ETV. Open one and you see the features your token spend shipped, and whether the work was growth, maintenance, or fixes.
Your AI bill stops being a number and starts being a feature list.
Weekly, monthly, and quarterly reports on what your teams are actually doing and what it cost. One page the board reads in two minutes.
676 engineers · 6 big-tech orgs · 5 quarters. Lines of code never saw it. ETV did.

ETV reads your commits once. That read pays off well past the ROI number.
Benchmark agency teams in the same ETV rate as your own. The premium only makes sense next to the output it actually buys.
The same data, read per team and per person. Outcome-based, not activity. Evidence to back the engineer the dashboards never credited.
Audit-ready CapEx and OpEx, derived straight from the code. No spreadsheets, no estimates.
Explore CapEx & OpExNatural-language questions across every metric, team, and timeframe. Cited answers, in real time.
That walkthrough assumed adoption is working. You’d be surprised how often we see the opposite.
Tell me which one your team is.
Your team is performing. Time to prove it.