The Story of Navigara: How We Built the Performance Layer for Modern Engineering
I’ve been a CTO. I know what it feels like to sit in a room full of dashboards and still not know the answer to the question everyone is too uncomfortable to ask out loud.
This is the story of how that feeling turned into a company.
We started somewhere completely different.
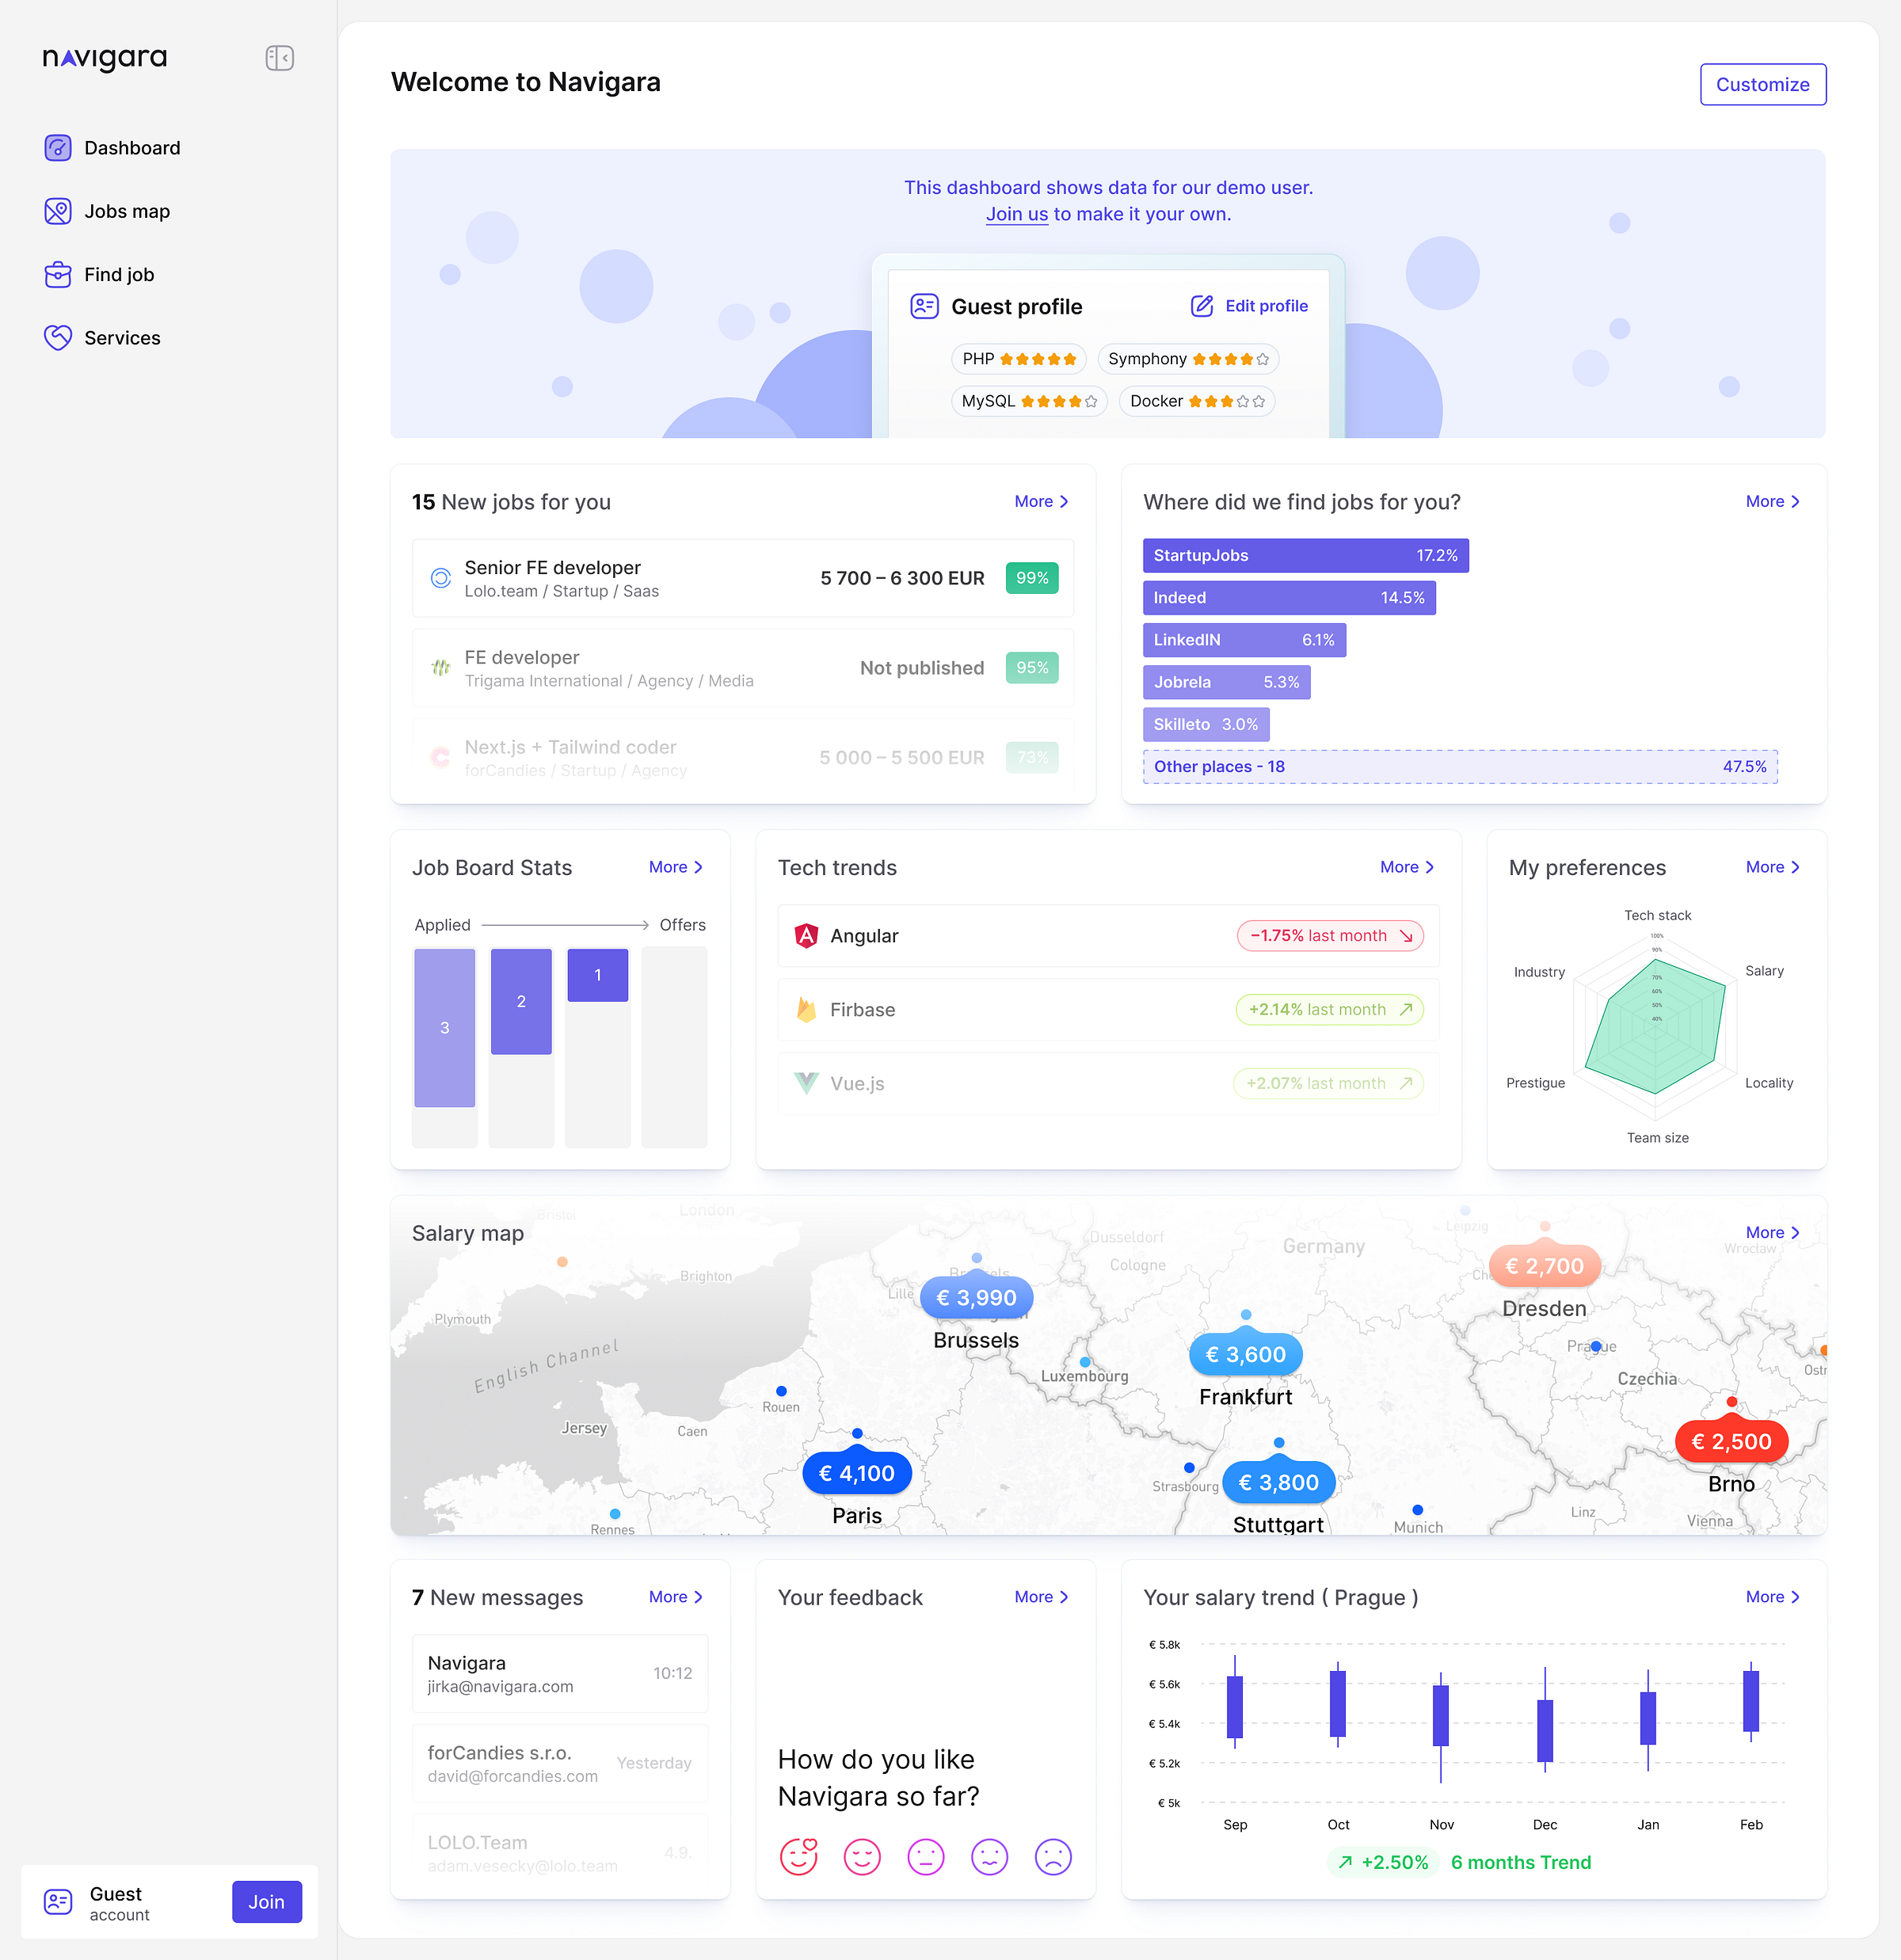
Navigara began as a platform for software engineers making career choices. We scraped thousands of companies to understand what they were doing, how well they were doing, and what people said about working there. We researched so the developer didn’t have to.
We also scraped job posts to understand how salaries move across the world. The result was that we could estimate your salary in more than 300 cities globally. Same developer, same stack. 50K in Prague, 300K in San Francisco. We could show you that.
The developer told us how proficient they were across programming languages, frameworks, databases, and the cloud. We translated that into a number. A real number, in a real city.
It worked until it didn’t.
The problem we couldn’t ignore
Self-evaluation is broken.
Developers overestimate. Developers underestimate. Some of them think a year of touching React makes them senior. Others have shipped production systems for a decade and call themselves “okay at it.” The input was the weakest part of the whole system, and the whole system depended on it.
So we said, fine, let’s test them. Build some homework, build some assessments, run AI interviews.
We tried these tools ourselves, and they felt like a tax on the developer for no real signal at the end. Take-homes are gamed. AI interviews feel like theatre. None of it captured what actually makes someone good at their job.
The realization that changed everything
The person who knows how good you really are is the coworker who has been reading your code for six months.
They might not sit in the same room as you. They might be in a different country. But they read your pull requests, they see how you respond to feedback, and they watch you ship or not ship. After a few months, they know exactly who you are as an engineer.
What we needed was an LLM to do that job.
We got it wrong the first time.
Our first version used the LLM as a judge. Rate this commit on a scale from 0 to 10 across 20 different factors. Quality, complexity, impact, you name it.
It failed. Hard.
LLMs are genuinely poor judges of this kind of work. The score distributions were almost flat. Everyone looked roughly the same. There was no signal we could use to benchmark engineers against each other or against themselves over time.
So we rebuilt the team around the problem. The new configuration looked at what we had, identified the methodology as the bottleneck, and redesigned the measurement engine from scratch. The unit that emerged from that process needed a name. Michal Habdank-Kolaczkowski, our chief storyteller, called it Engineering Throughput Value. It stuck.
The shift that made everything click
You cannot point a tool at a repository and ask, “Is this commit good?” The model has no idea what the project is. It doesn’t know the architecture, conventions, history, or constraints.
So we flipped the role. The LLM is no longer the judge. The LLM is the storyteller.
Its job is to understand the repository deeply, build context, and then tell us the story behind every commit. What changed, why it likely changed, how it fits into what came before, and what it means in the bigger picture.
That story becomes structured input. The actual evaluation happens in our system, not inside a model, making vibes-based decisions.

The unit we had to invent
Lines of code. Commit count. Story points. DORA. Each answers a different question. None answers the one that matters. Did the output get more valuable, or just more numerous?
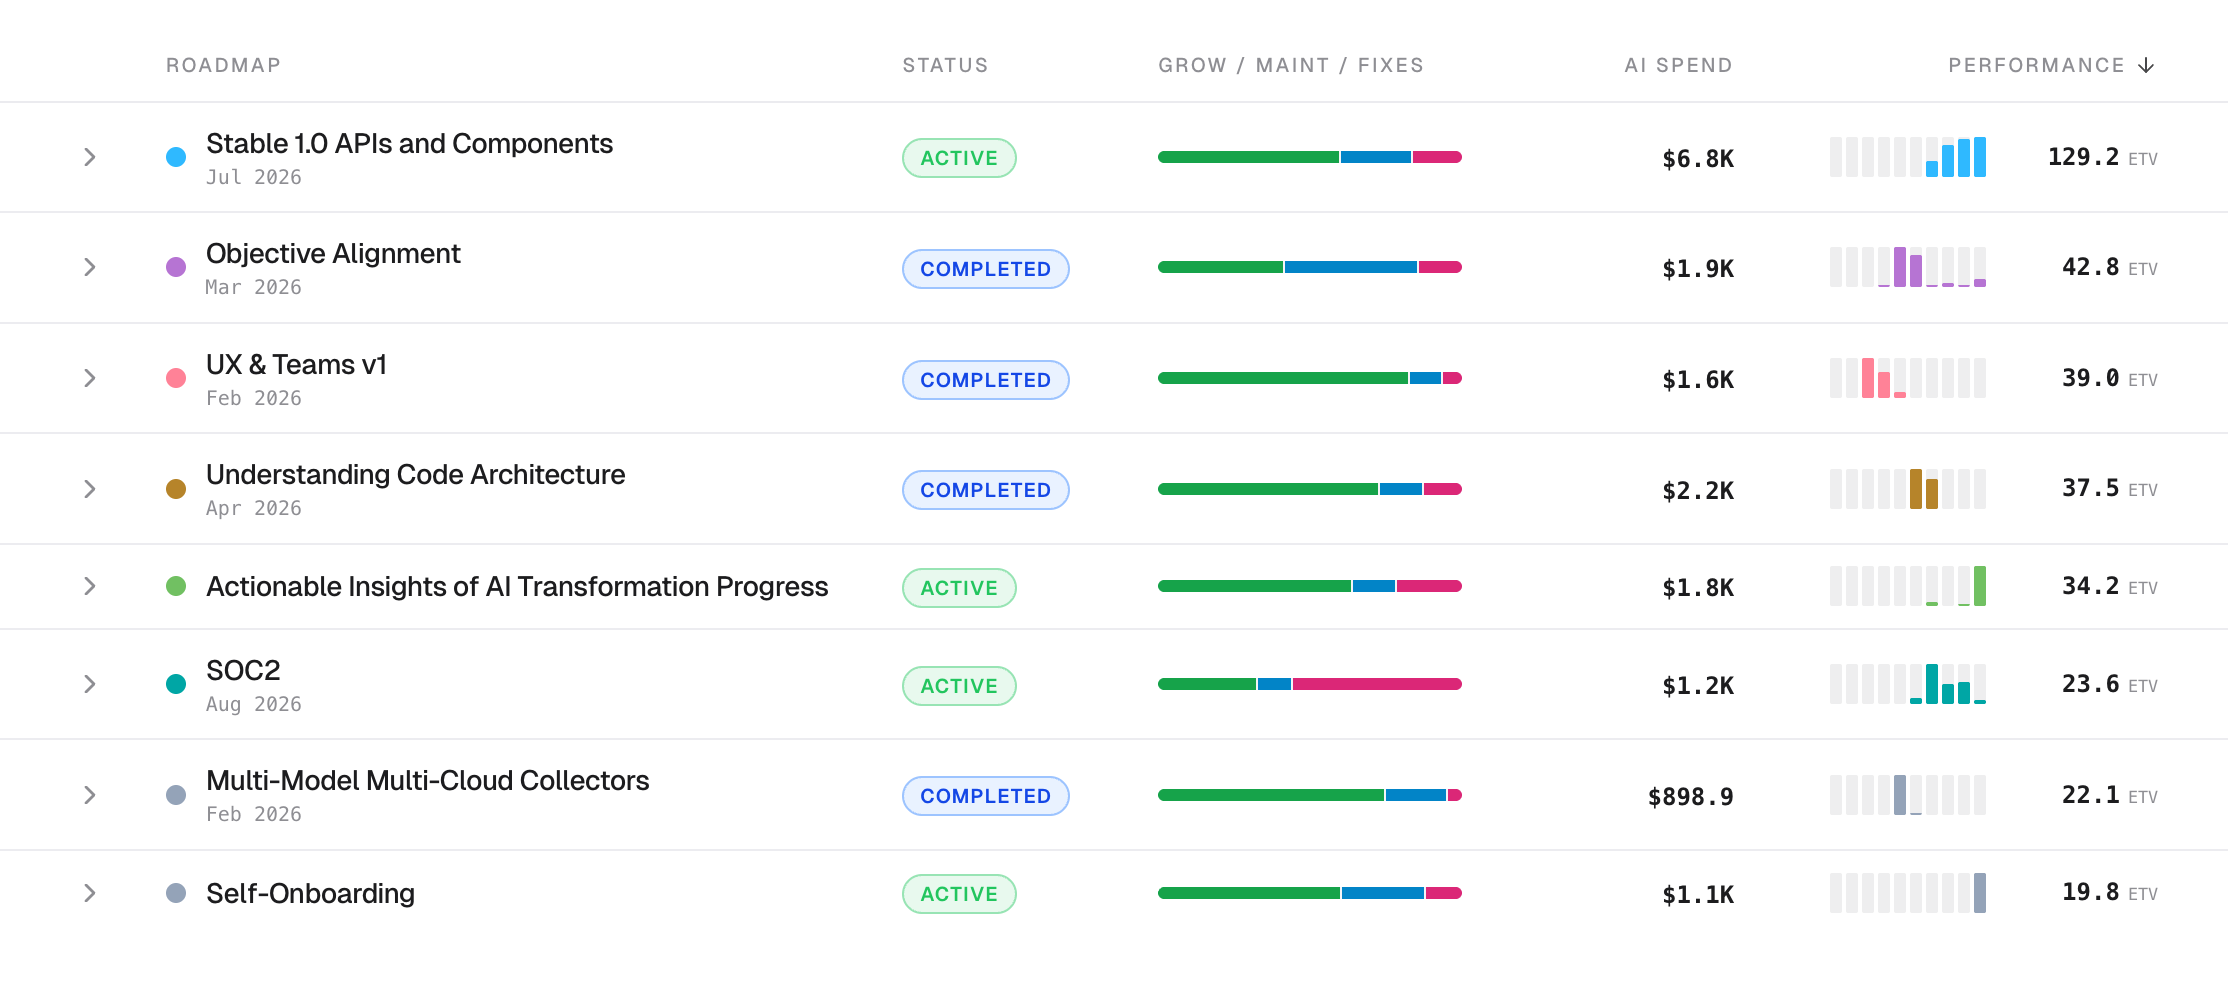
ETV (Engineering Throughput Value) is a unit of performance, produced by a measurement engine that reads code the way a senior engineer does. Not just what changed, but what it meant, where it landed, and whether it touched the architecture.
ETV is applied per file and per merged commit and combines five factors.
- Complexity, the structural weight of the change itself
- Engagement is the ratio of surrounding code complexity to change complexity, so targeted edits in dense areas score higher than equivalent edits in trivial files
- Architecture, where the change lands in the feature graph. Deeply connected features carry more weight than peripheral ones
- Decay, which reduces credit when a change isn’t real cognitive work. Mechanical refactors, self-rewrites of yesterday’s code, copy-paste from elsewhere in the repo
- Multiplier, which amplifies fixes when the bug was costly. Old code, unfamiliar code, high-churn areas
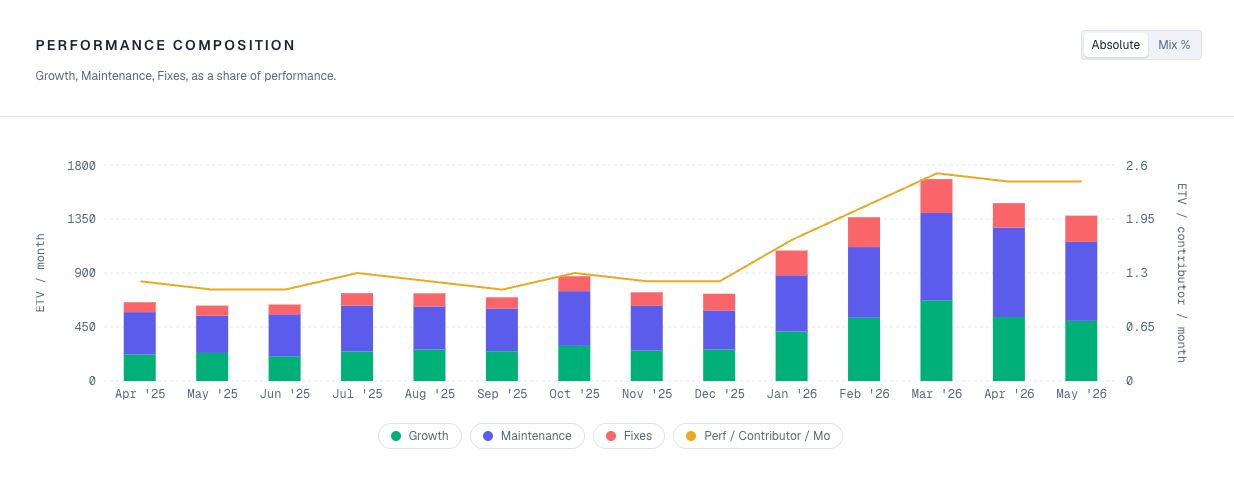
Each file contributes to one of three buckets. Growth, Maintenance, or Fixes. The buckets stay separate, on purpose. Two engineers with identical ETV totals can be doing very different work, and the score shows it.
ETV is answerable solely from the commit history. No PM tools. No surveys. No self-report. The repo already has the answer. We just had to learn how to read it.
Why does this make us the performance layer?
There is an engineer on your team right now who is carrying more than anyone knows. Not the loudest person in standup. Not the one with the most PRs. The one whose commits keep showing up in the high-complexity, high-architecture zones, quietly doing the work that holds everything else together. Without ETV, that person is invisible to any conversation happening above the engineering floor. With it, you can walk into a leadership meeting and point to exactly what they built and what it would cost to lose them.
The same logic applies to AI. Your CFO will ask whether Copilot is producing real value or just issuing real invoices. The honest answer for most teams is: we think so. ETV gives you the before-and-after baseline to answer that question with data instead of a feeling.
Everything else downstream, the work-to-revenue line, the one-on-ones grounded in evidence, the engineering news, the KPIs that survive scrutiny, the CapEx and OpEx pulled straight from commits, follows from understanding what is actually happening in the code. That’s the layer. That’s what we are. Navigara.com
Where we go next
We’re going deeper into open source.
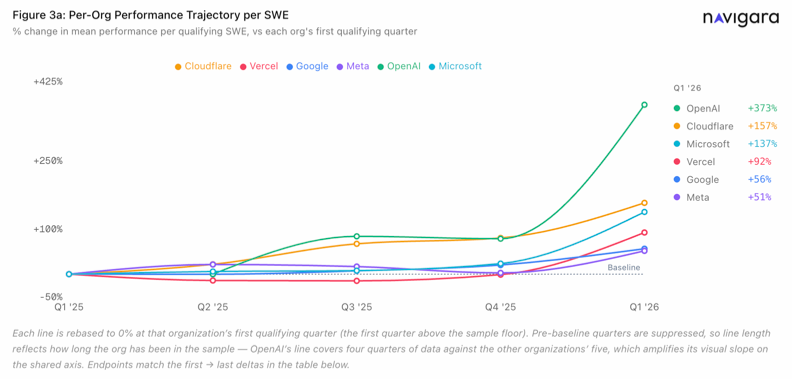
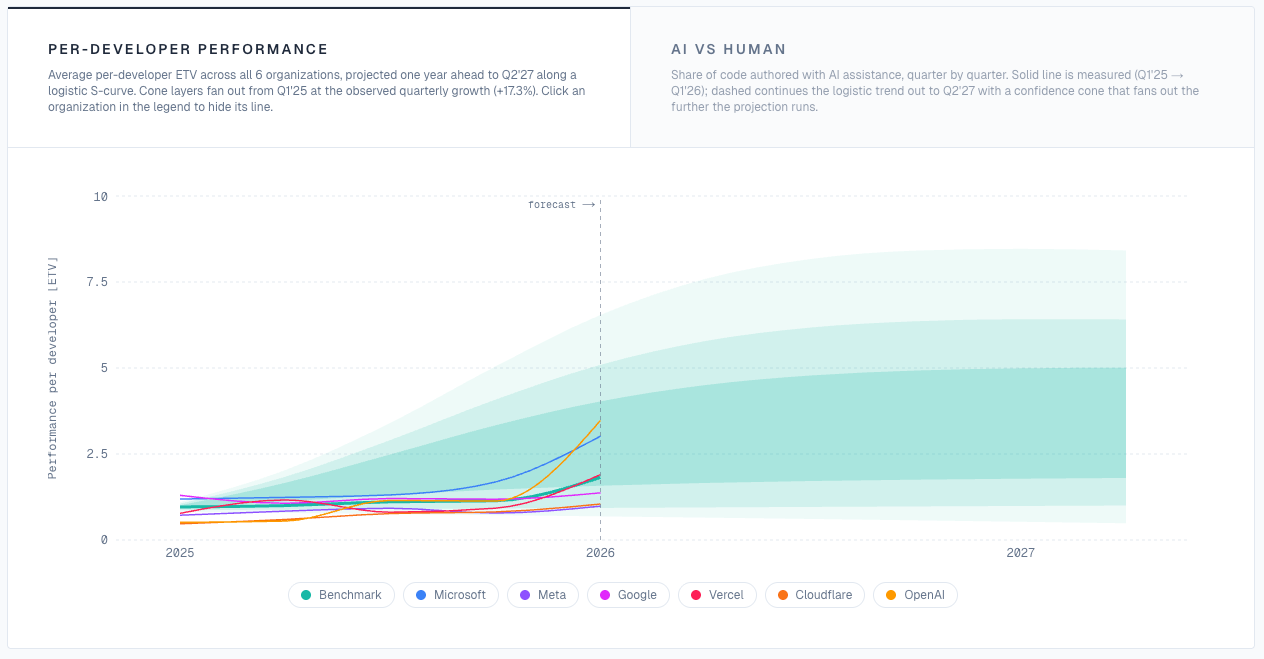
Open source repos are the largest public record of how engineering actually happens. The decisions, the rewrites, the heroics, the slow burns, the projects that died, and the projects that became infrastructure for the entire internet. The first edition of our research covered six big tech companies across five quarters. The next one goes wider.
OSS is also the only place we can watch the AI transition happen in real time. Cursor adoption, Claude Code rollouts, agentic workflows replacing scripted ones, none of it stays hidden once you know how to read commit history. Engineers ship differently when their tools change, and the diff shows up in public before anyone publishes a blog post about it.
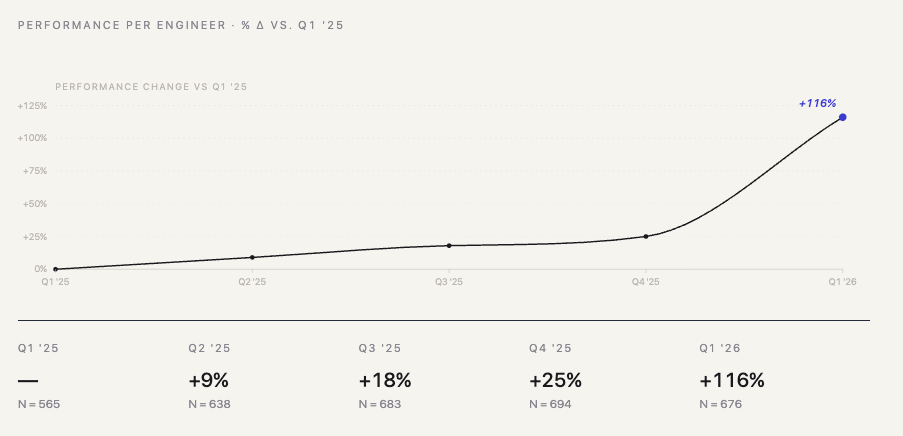
The signal wasn’t the size of the jump. It was the shape. Four quarters of clean linear growth, +9, +18, +25. A linear extrapolation put Q1 2026 at roughly +33. We measured +116. The line didn’t bend, it broke.
The absolute numbers are still small. 66 repos, 6 companies, 676 engineers, five quarters. A skeptic can pick that apart, and they should. But the YoY shape across that sample is consistent enough that we’re willing to put a marker in the ground.
I’ve sat with Stanford professors who think there will be no software developers in two years. Three in Europe. I don’t buy it, but I’m not going to argue about it in a blog post. Open source will tell us who was right.
Here’s the marker. The day a developer ships 100x what they shipped before AI, that’s the day AI took over engineering. Not when a CEO tweets it. Not when a vendor benchmarks it. When the commit history says it.
We’ll be tracking it across a lot more repos than this. Live, in public, in the same methodology. If the number gets there, you’ll see it the same day we do.
The last black box
Companies have observability for their infrastructure. Analytics for their product. CRMs for their customers. BI tools for their finances.
Engineering performance was the last black box. The work that drives the entire company forward, and nobody could see inside it.
That’s the gap we’re closing. That’s why Navigara exists. The more we build, the more obvious it becomes that this layer was always supposed to be here. We just had to take the long way around to find it.