Benchmark Engineering Before You Wire the Money
If you invest at Series B and later, you measure everything before you wire the money. Financials and unit economics to the decimal. Legal and contracts. Market and competition. Customer and revenue quality. All of it underwritten with real diligence.
Engineering is the exception. The line item that often drives the entire thesis gets assessed on vibes: a few reference calls, the founder’s velocity story, and a roadmap slide that any org chart can claim. You underwrite everything but engineering on faith.
Technical due diligence is expensive guesswork
Today the fix is a one-off audit. Weeks of interviews, a six-figure invoice, and a snapshot that is stale the day the consultants leave.
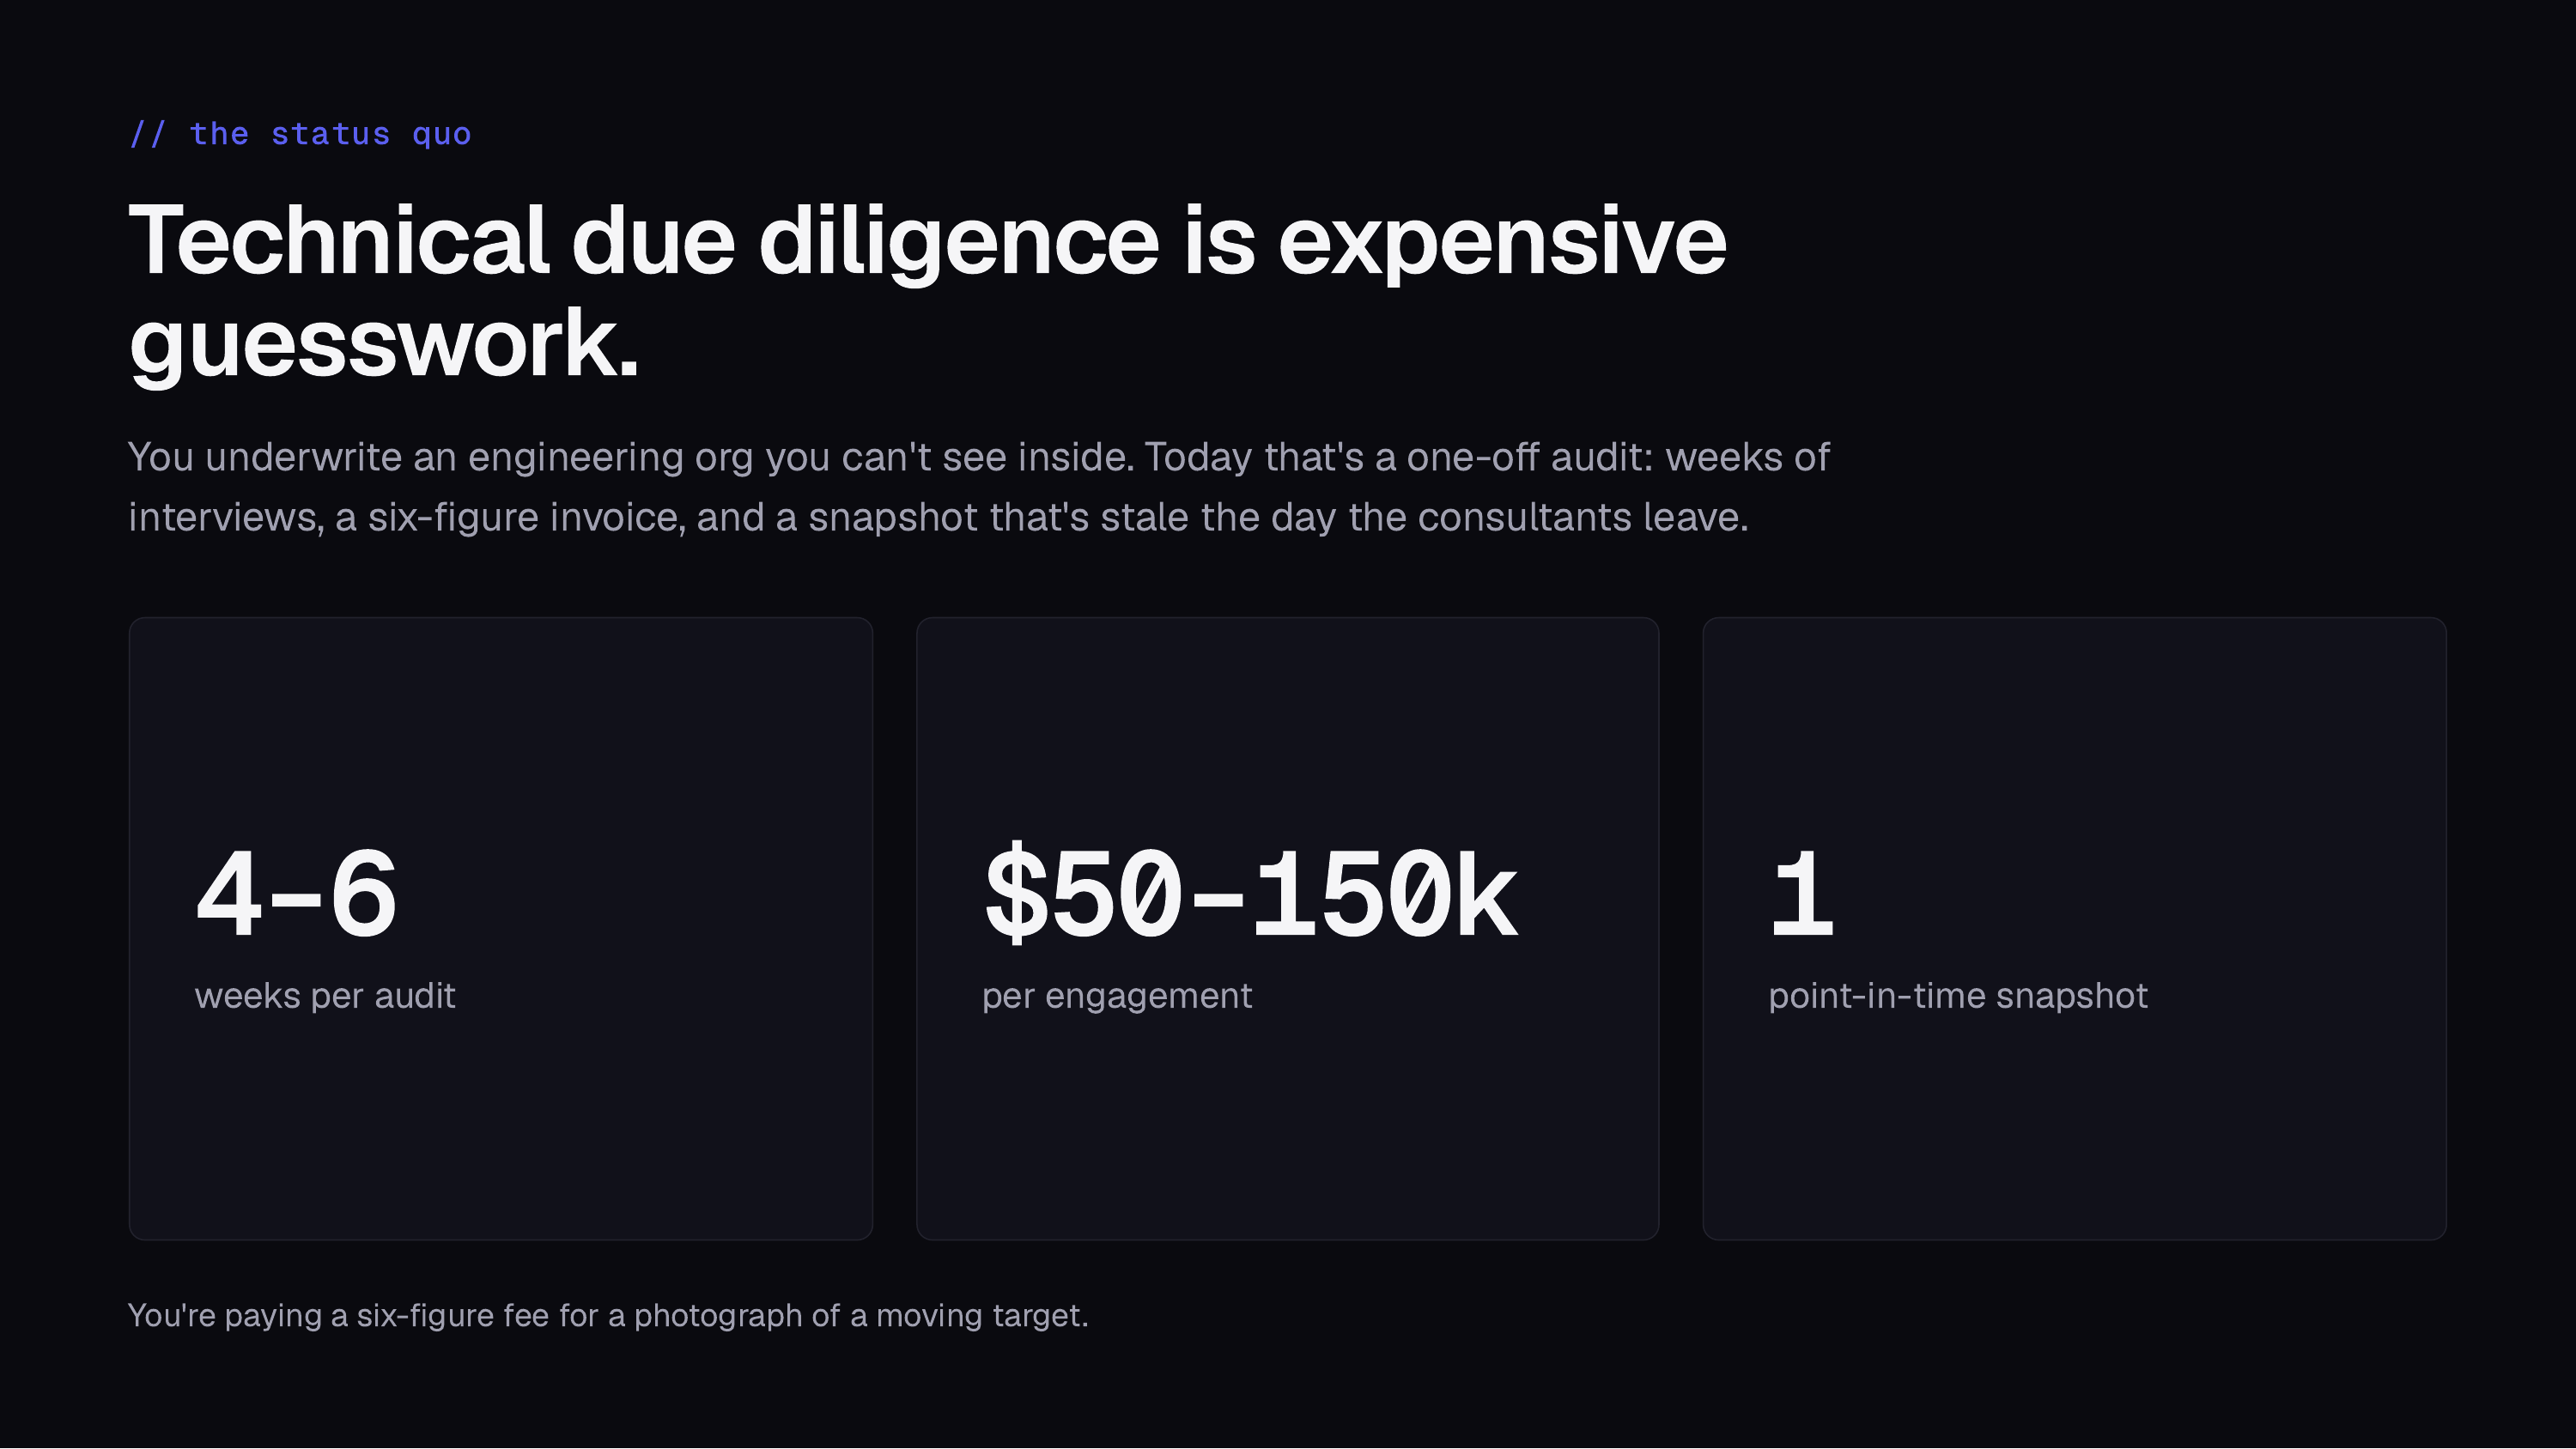
You are paying a six-figure fee for a photograph of a moving target. It tells you what an engineering org looked like for one week, with no benchmark to say whether that is any good.
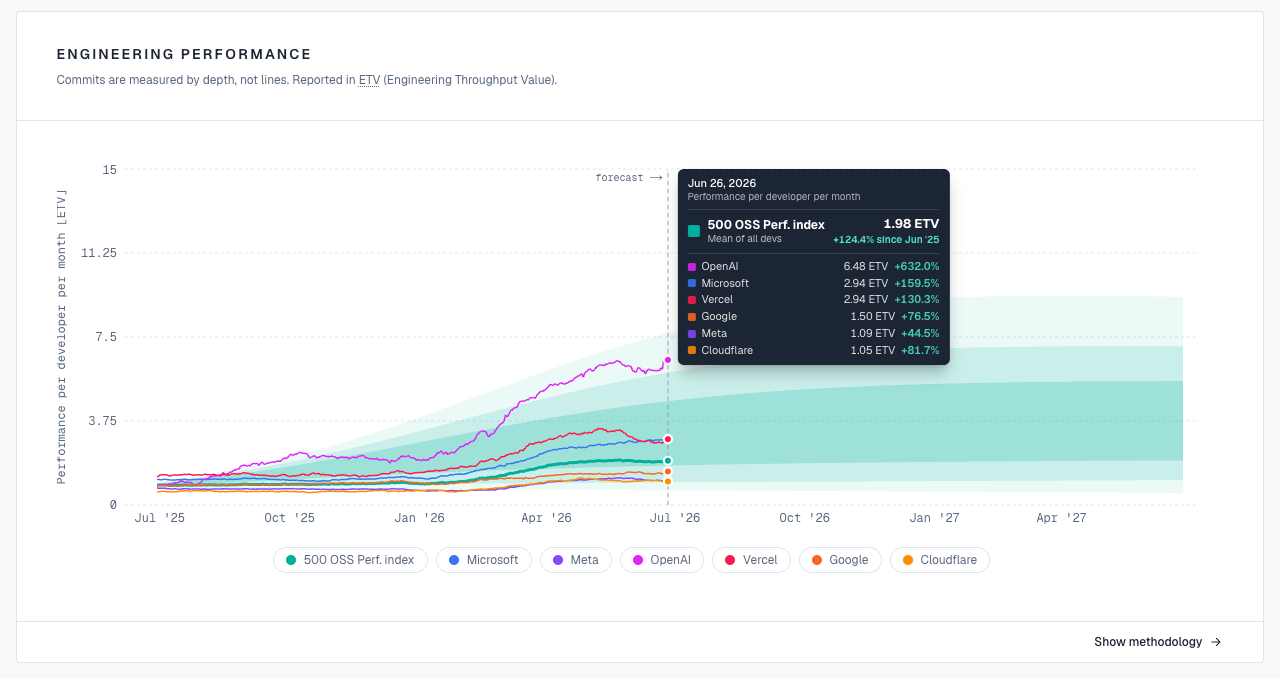
The gap between an average team and a top one has never been wider
Across the top open-source organizations, output per developer now spans roughly 5x, from Cloudflare at 1.05 to OpenAI at 5.92 ETV per developer per month on a trailing twelve months. Same kind of work, same scale, five times the throughput.
AI leverage is what compounds that gap. Median output across the top open-source orgs rose 123% in the last twelve months, from 0.86 to 1.93 ETV per developer per month. At the extremes, OpenAI’s total output grew 1,309% year over year while Meta’s grew 37%. The leaders are pulling away, and tooling spend alone does not buy a laggard past them.
This is why engineering output is the signal that matters now. Every company in a portfolio has an AI strategy. Engineering output is where you find out whether it is true, quarters before it reaches revenue. A transformation slide costs nothing to write. The rate a team actually ships cannot be faked.
Your winners are the benchmark
An internal average flatters everyone. The benchmark that matters is the engineering of the companies that actually returned your funds, ranked at the same stage as the target.
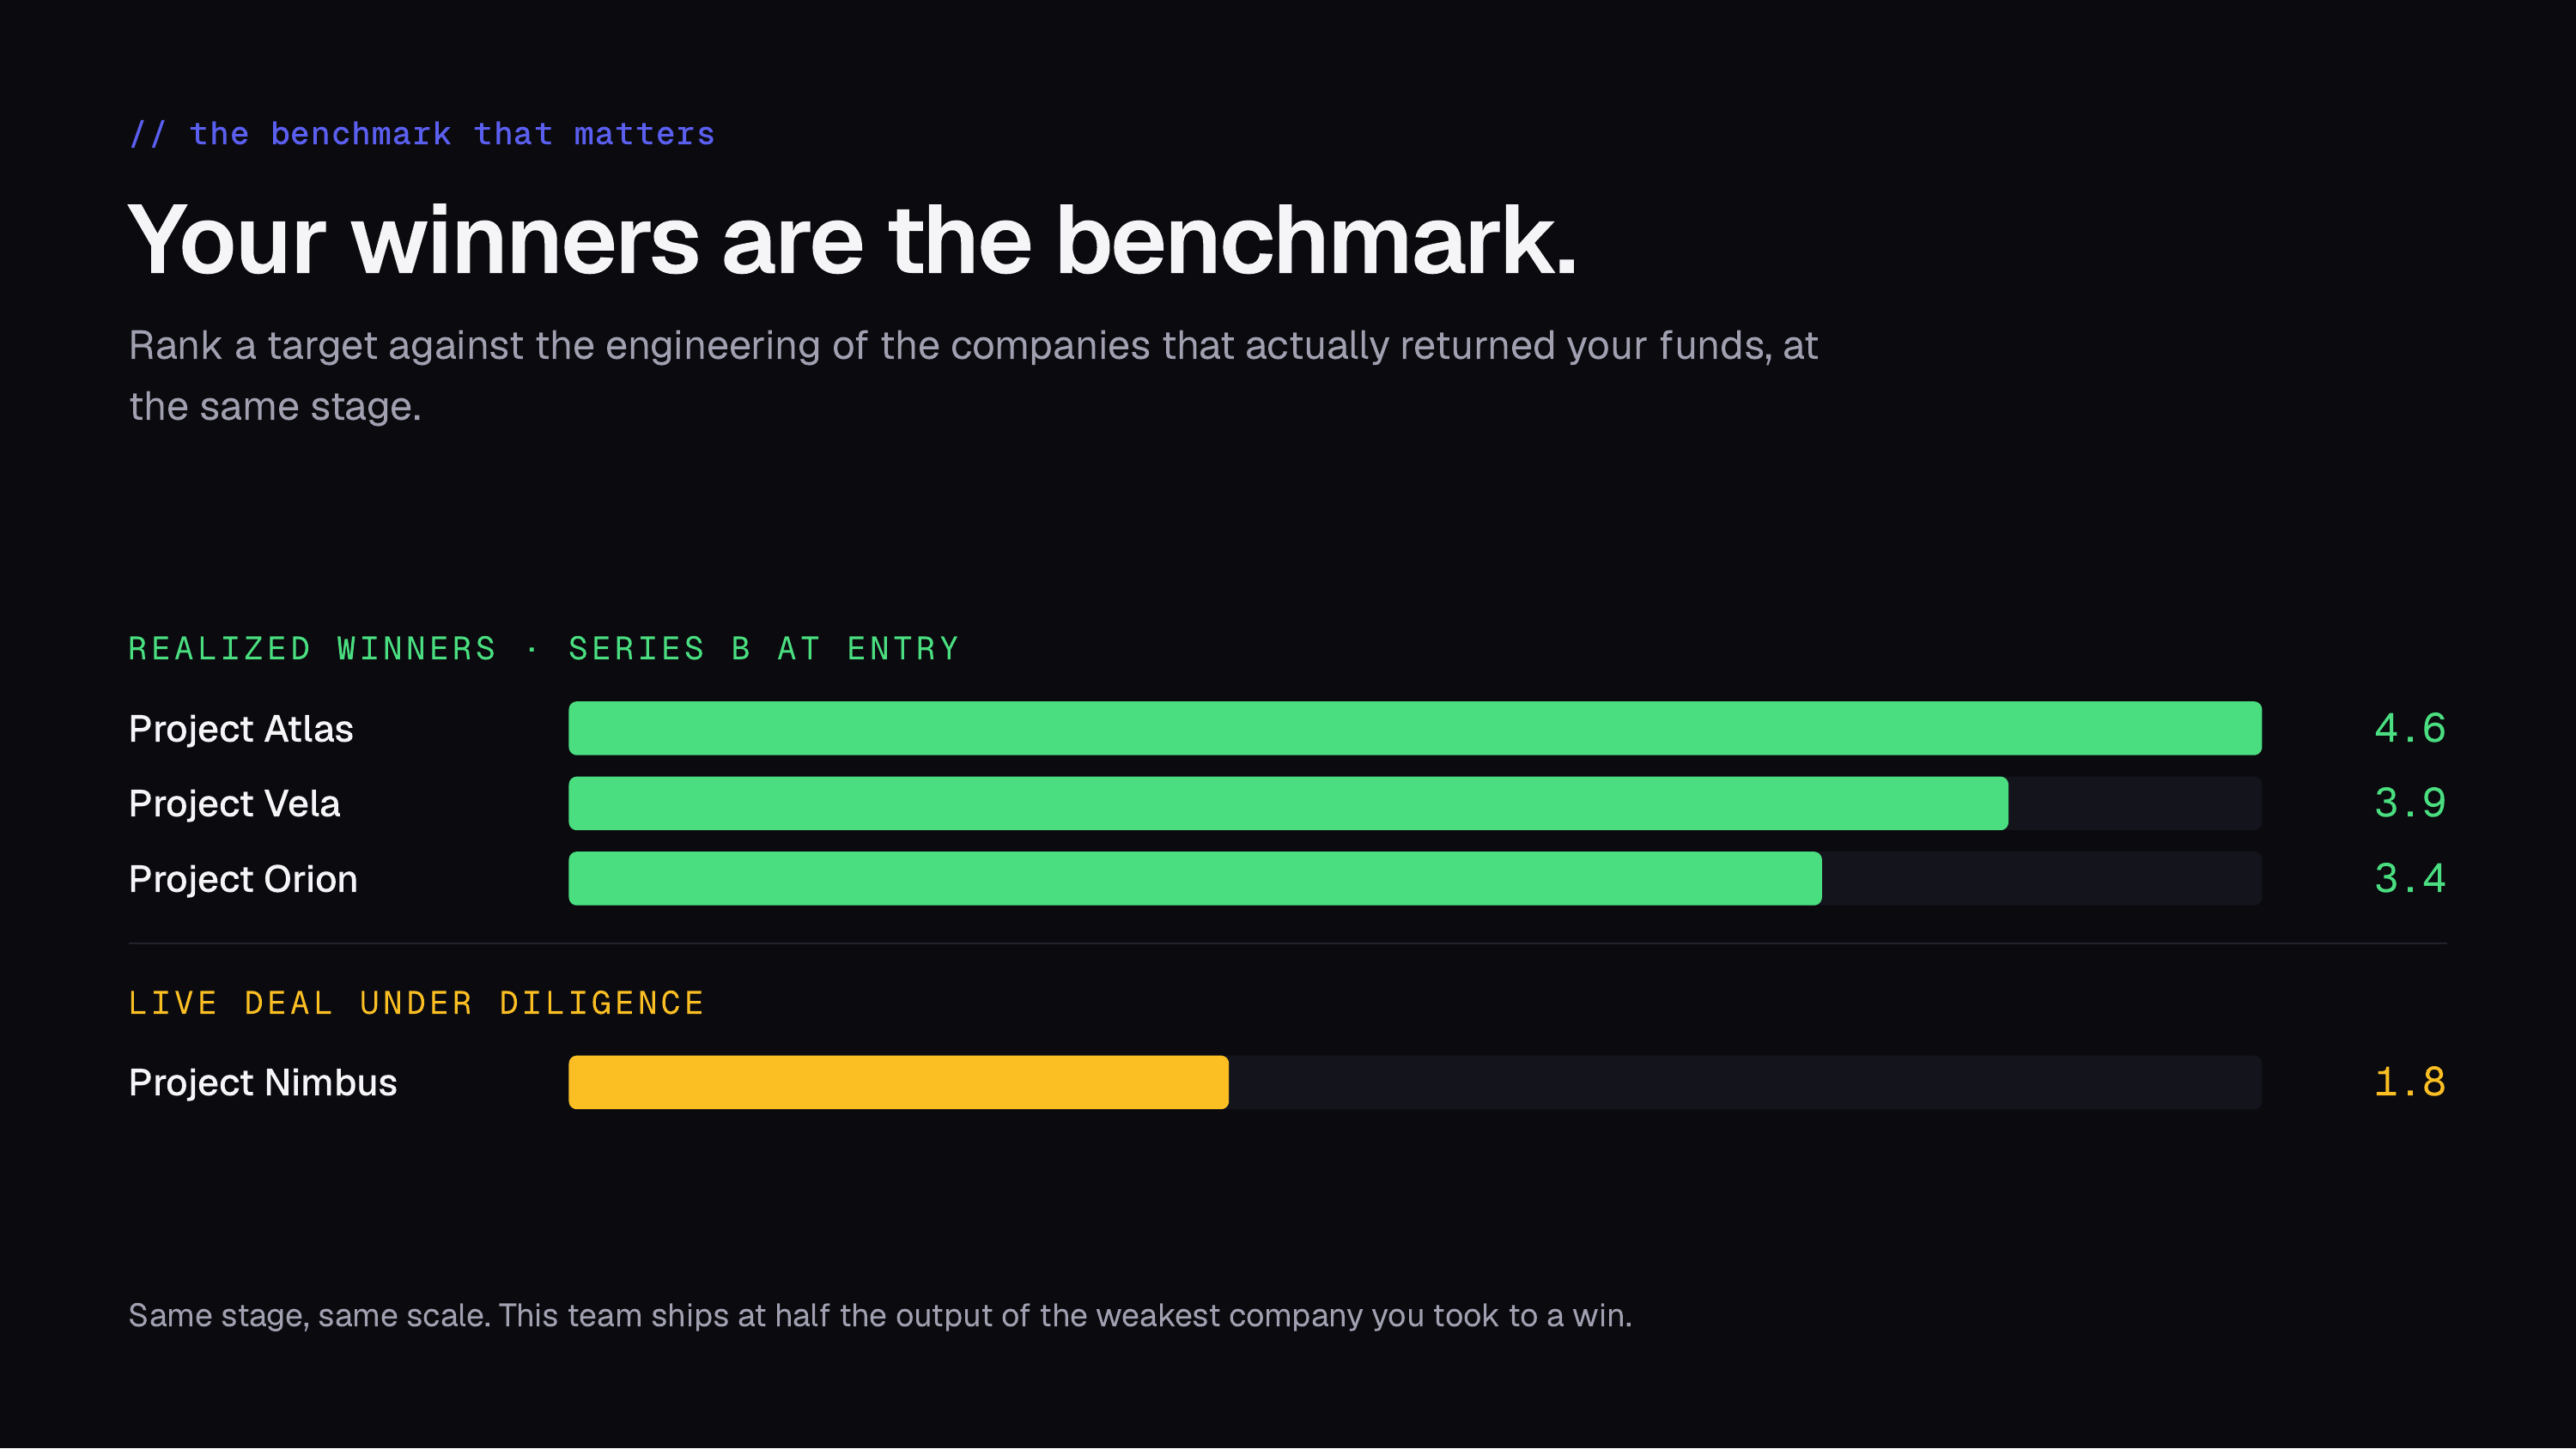
Put a live deal on the same scale as your realized winners at entry, and the verdict is immediate. A target shipping 1.8 ETV per developer per month is running at roughly half the output of the weakest company you took to a win. Above your winners sits the frontier: the Codex team at OpenAI, building inside Microsoft’s VSCode, sustains 6.3 ETV per developer per month. The question stops being “is this a good team?” and becomes “where does this team sit against the best, and is the gap closing or widening?”
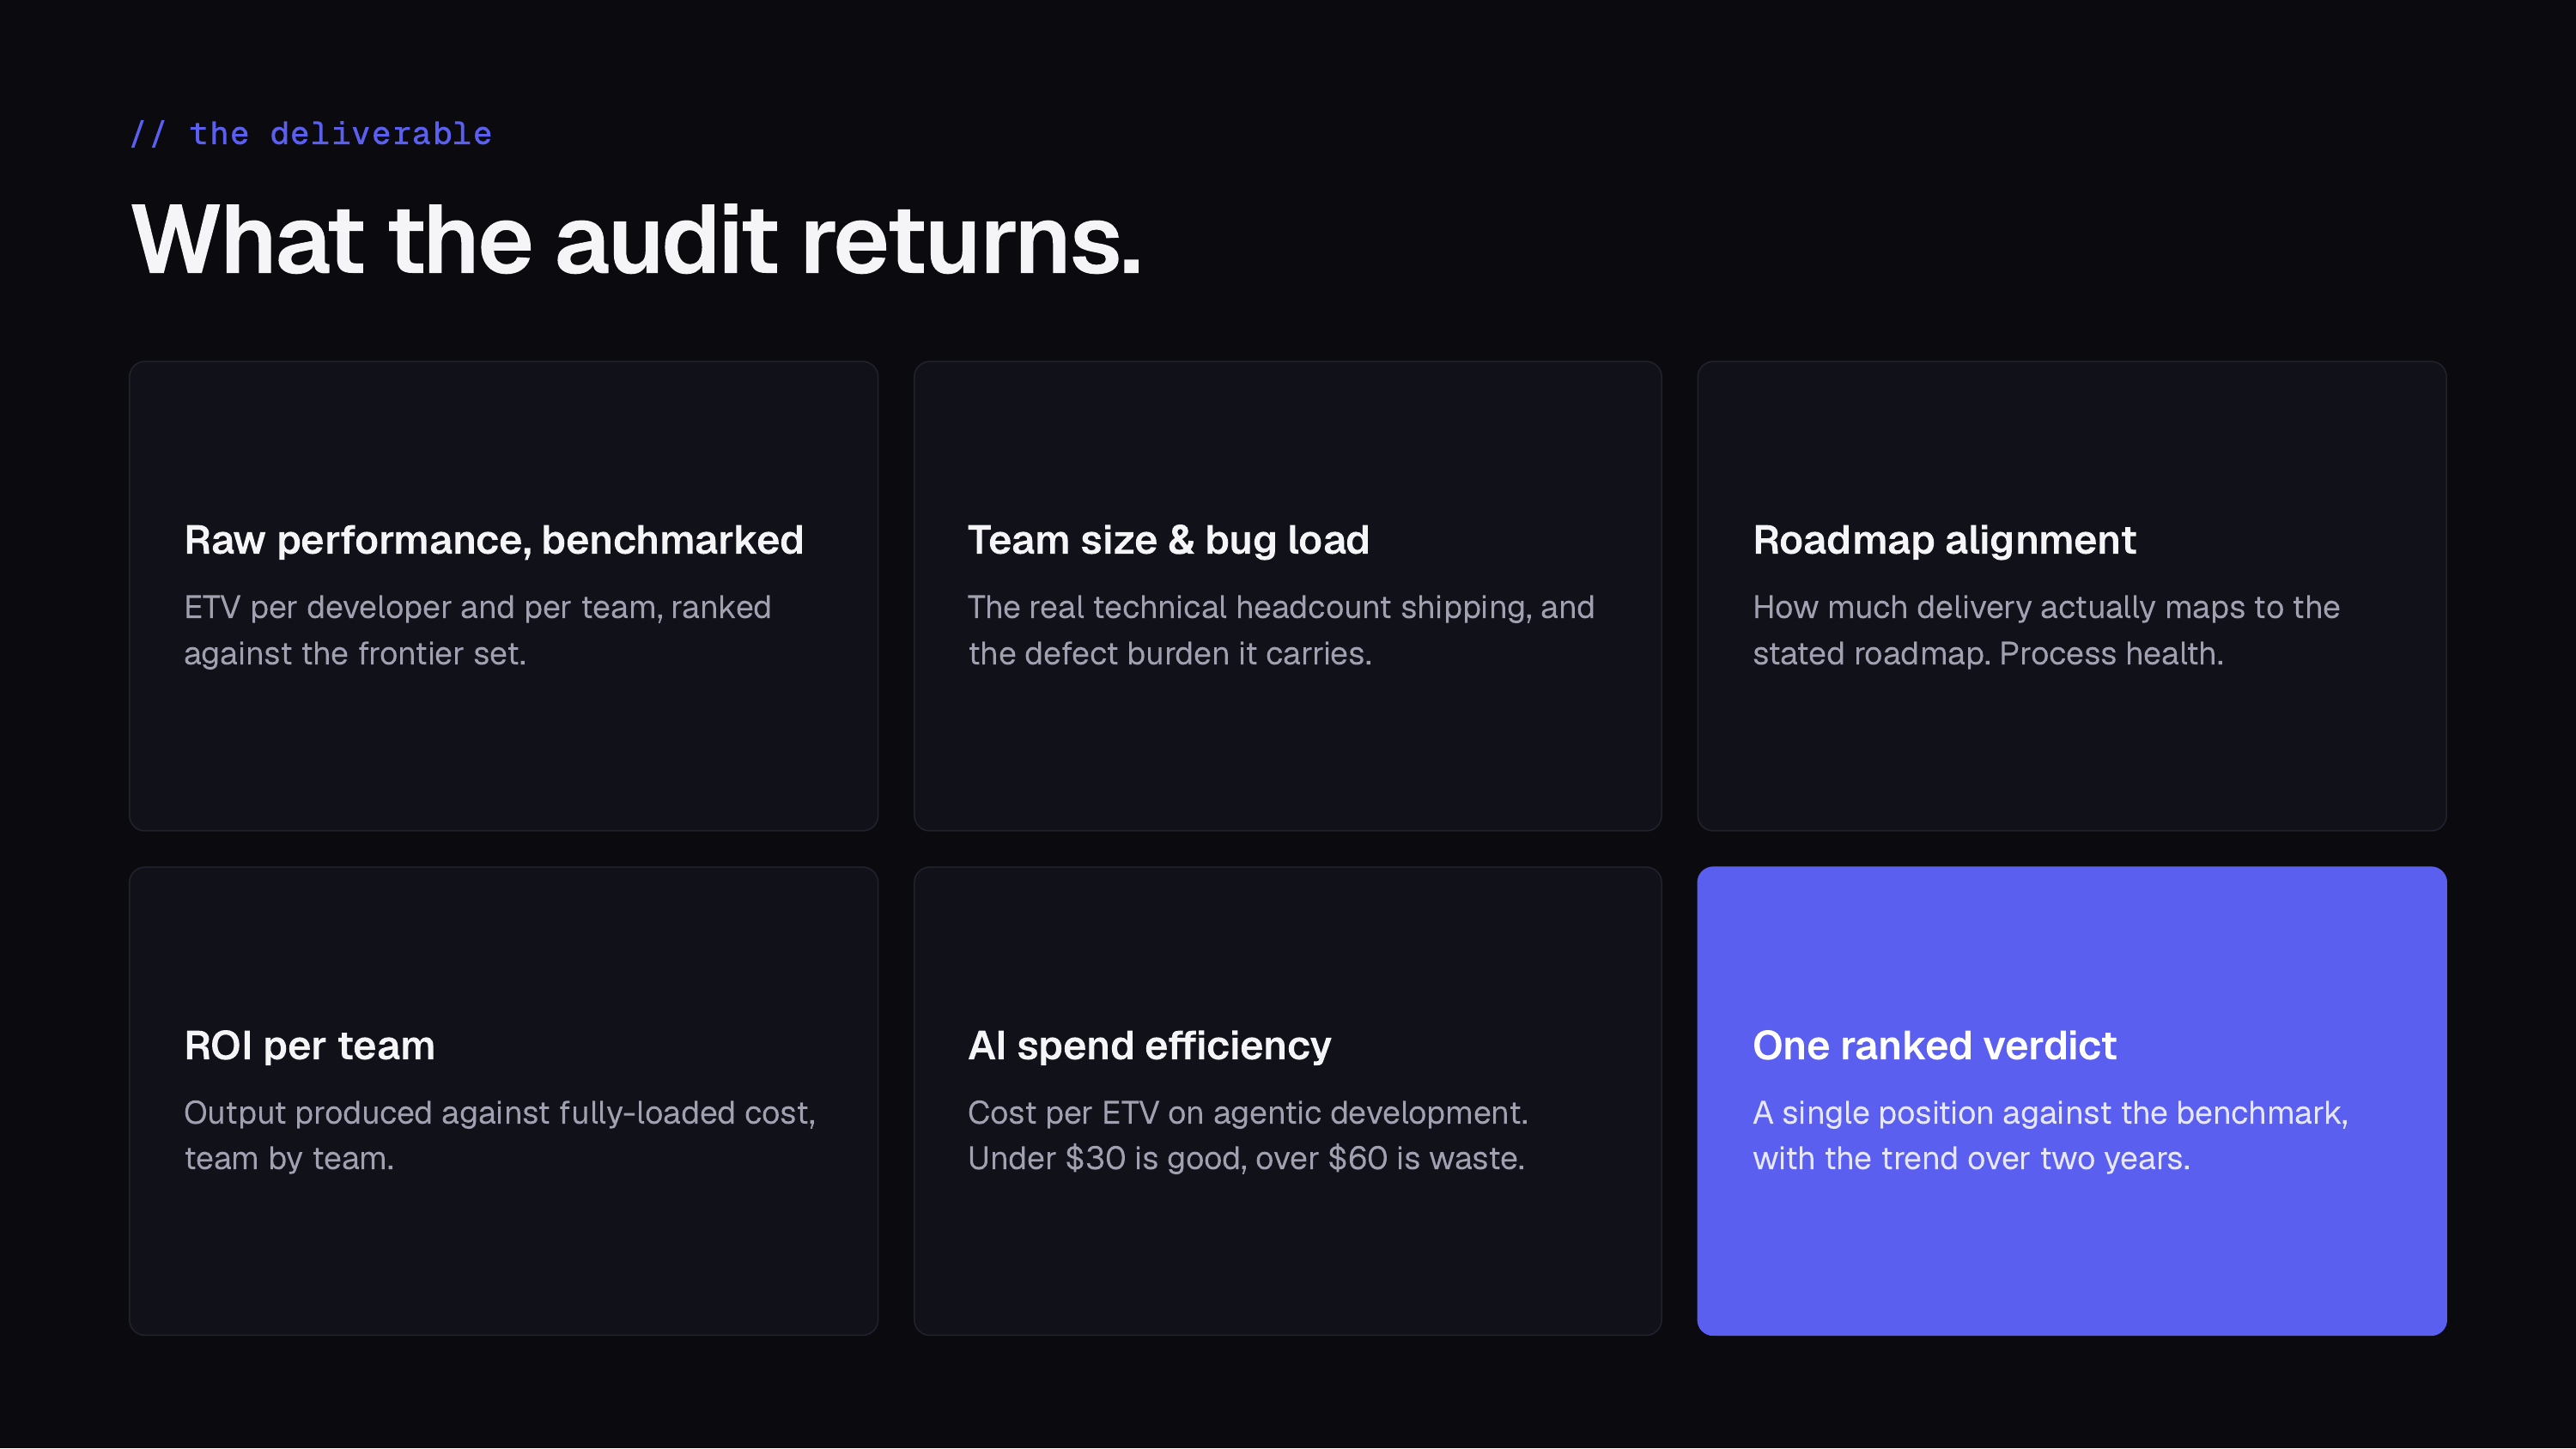
What the audit returns
Every engagement returns the same structured read: raw performance per developer and per team ranked against the frontier set, the real technical headcount shipping and the defect burden it carries, how much delivery actually maps to the stated roadmap, ROI per team against fully-loaded cost, and AI spend efficiency measured as cost per ETV (under $30 is good, over $60 is waste). It resolves to one ranked verdict, with the trend over two years.
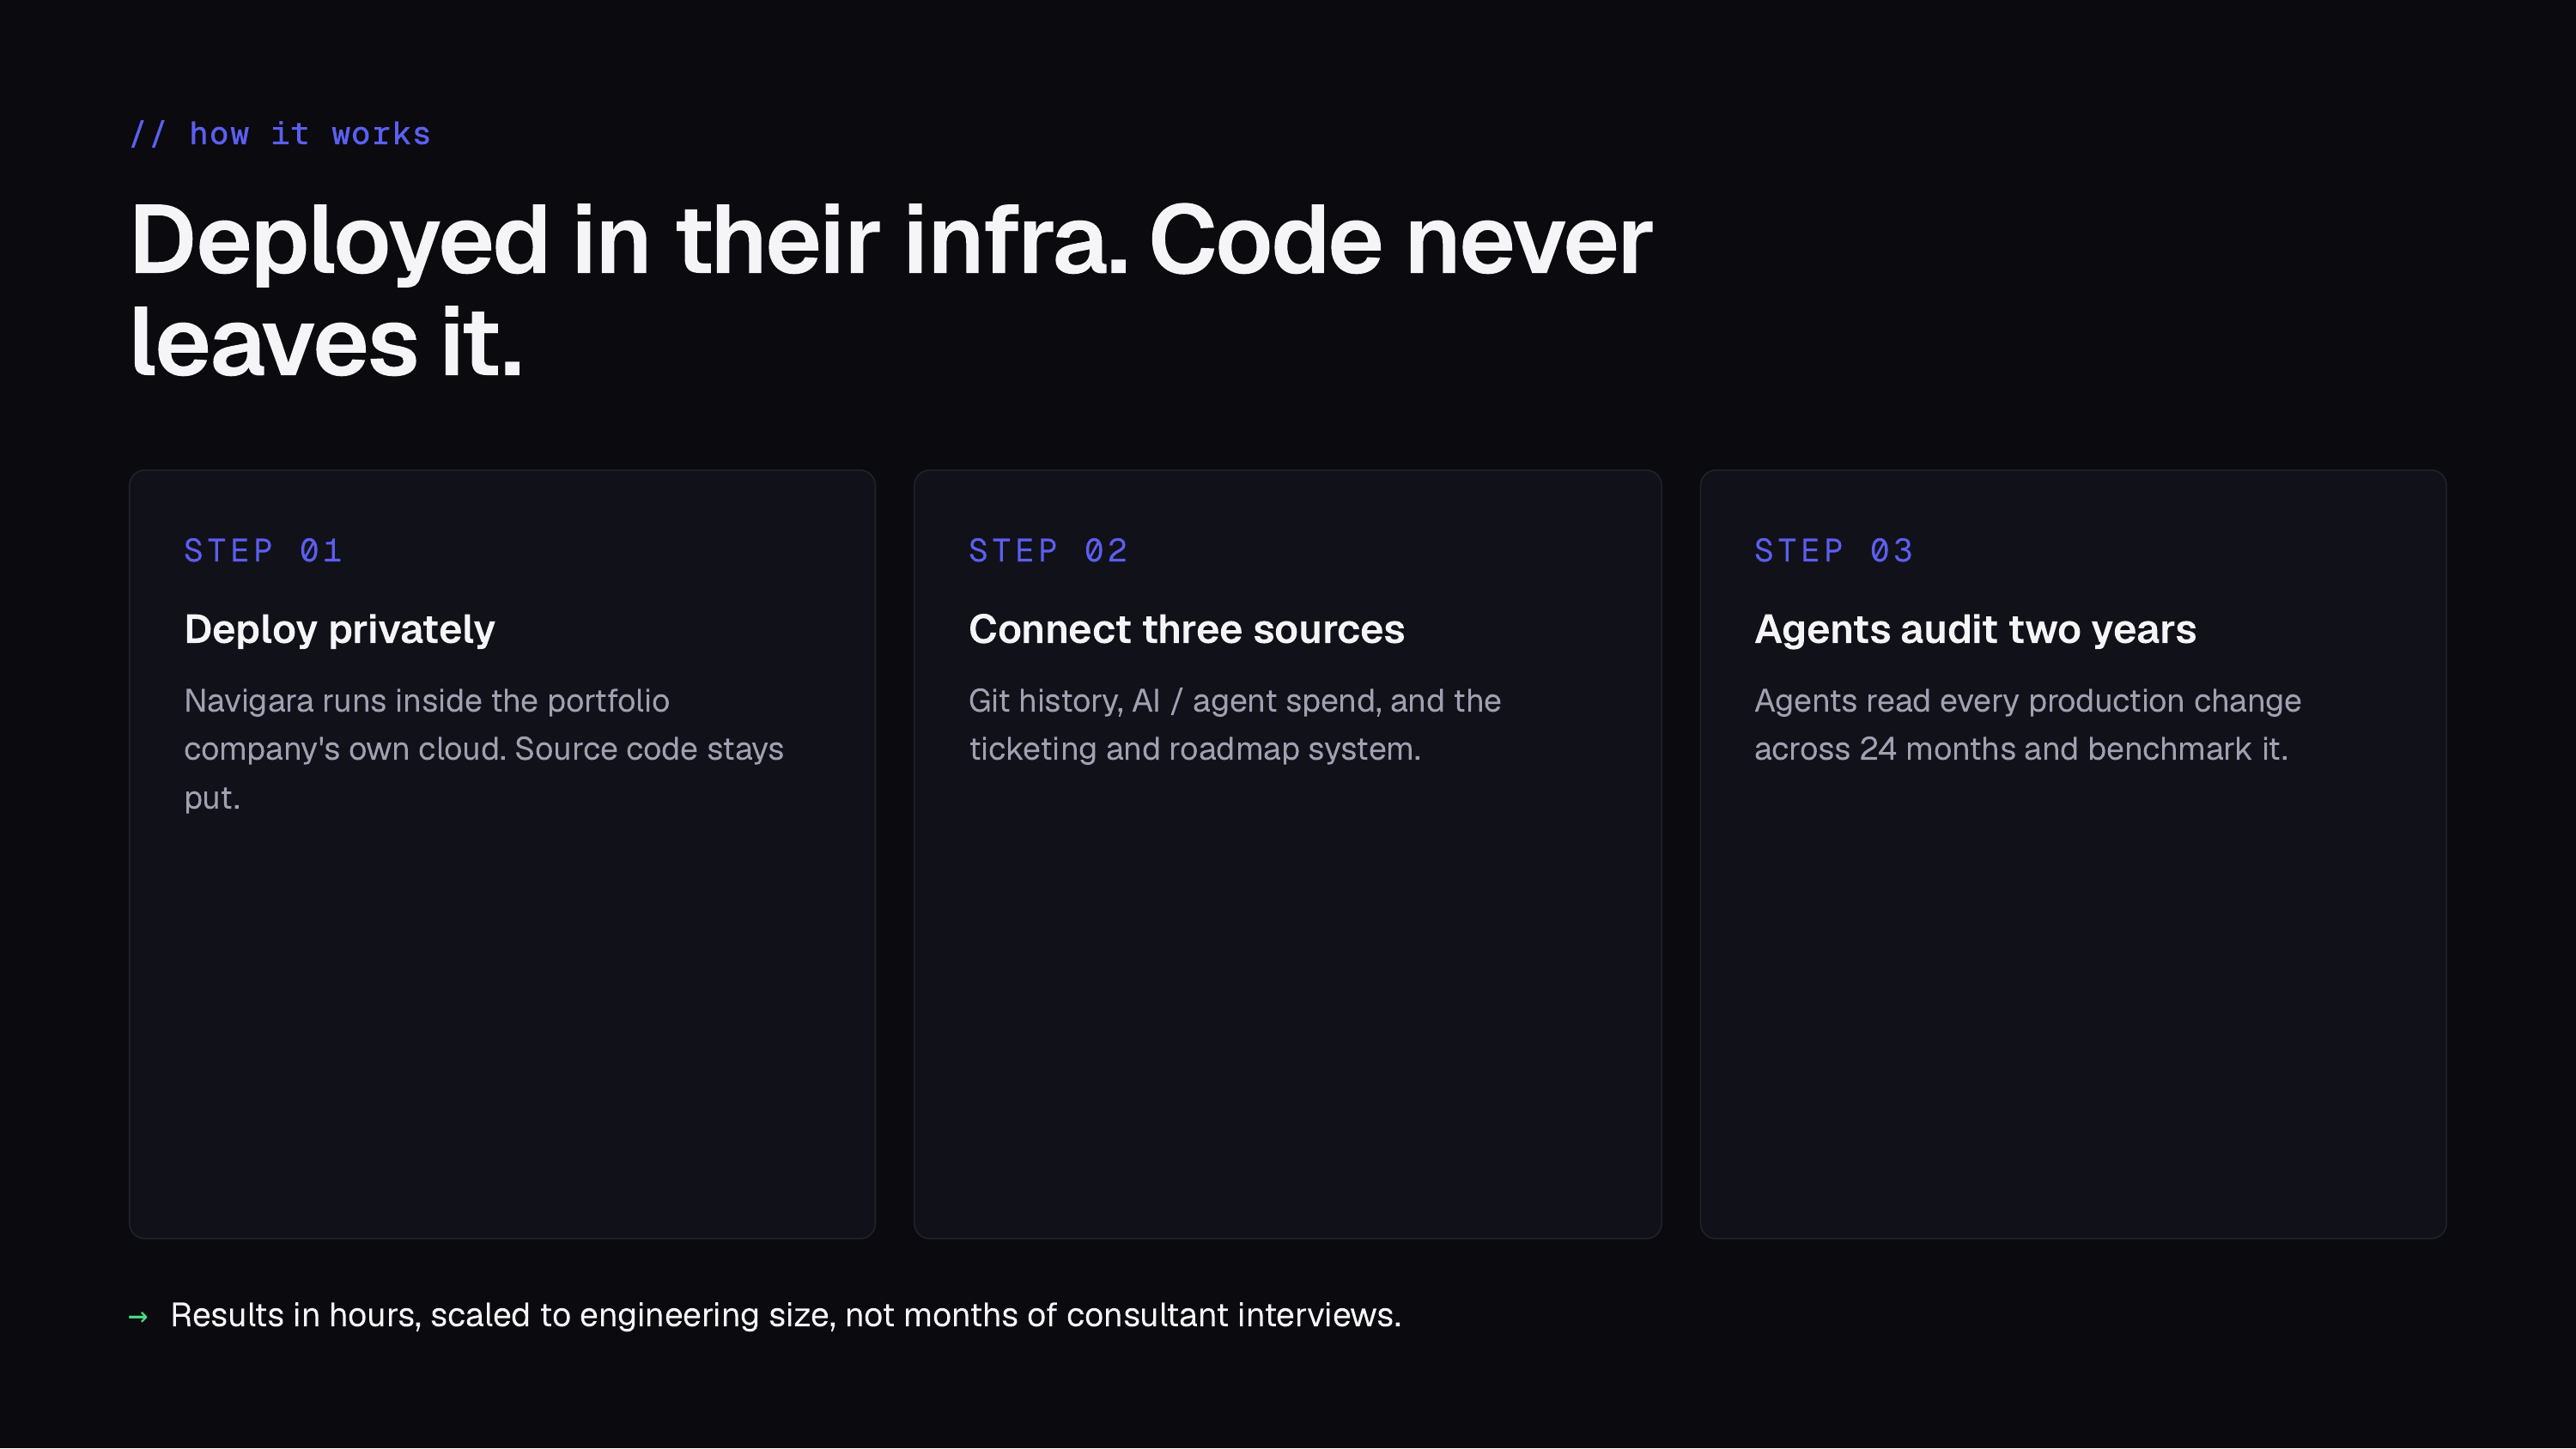
Deployed in their infra. Code never leaves it.
Navigara runs inside the portfolio company’s own cloud, so source code stays put. It connects three sources, git history, AI and agent spend, and the ticketing and roadmap system, then agents read every production change across twenty-four months and benchmark it. Results come back in hours, scaled to the size of the engineering org, not months of consultant interviews.
Because the read comes from the code itself, it is the same number whether the CTO is in the room or not. No vibes, no proxies, no self-reports. The black box becomes a ledger you can audit.
Continuous, not a one-off
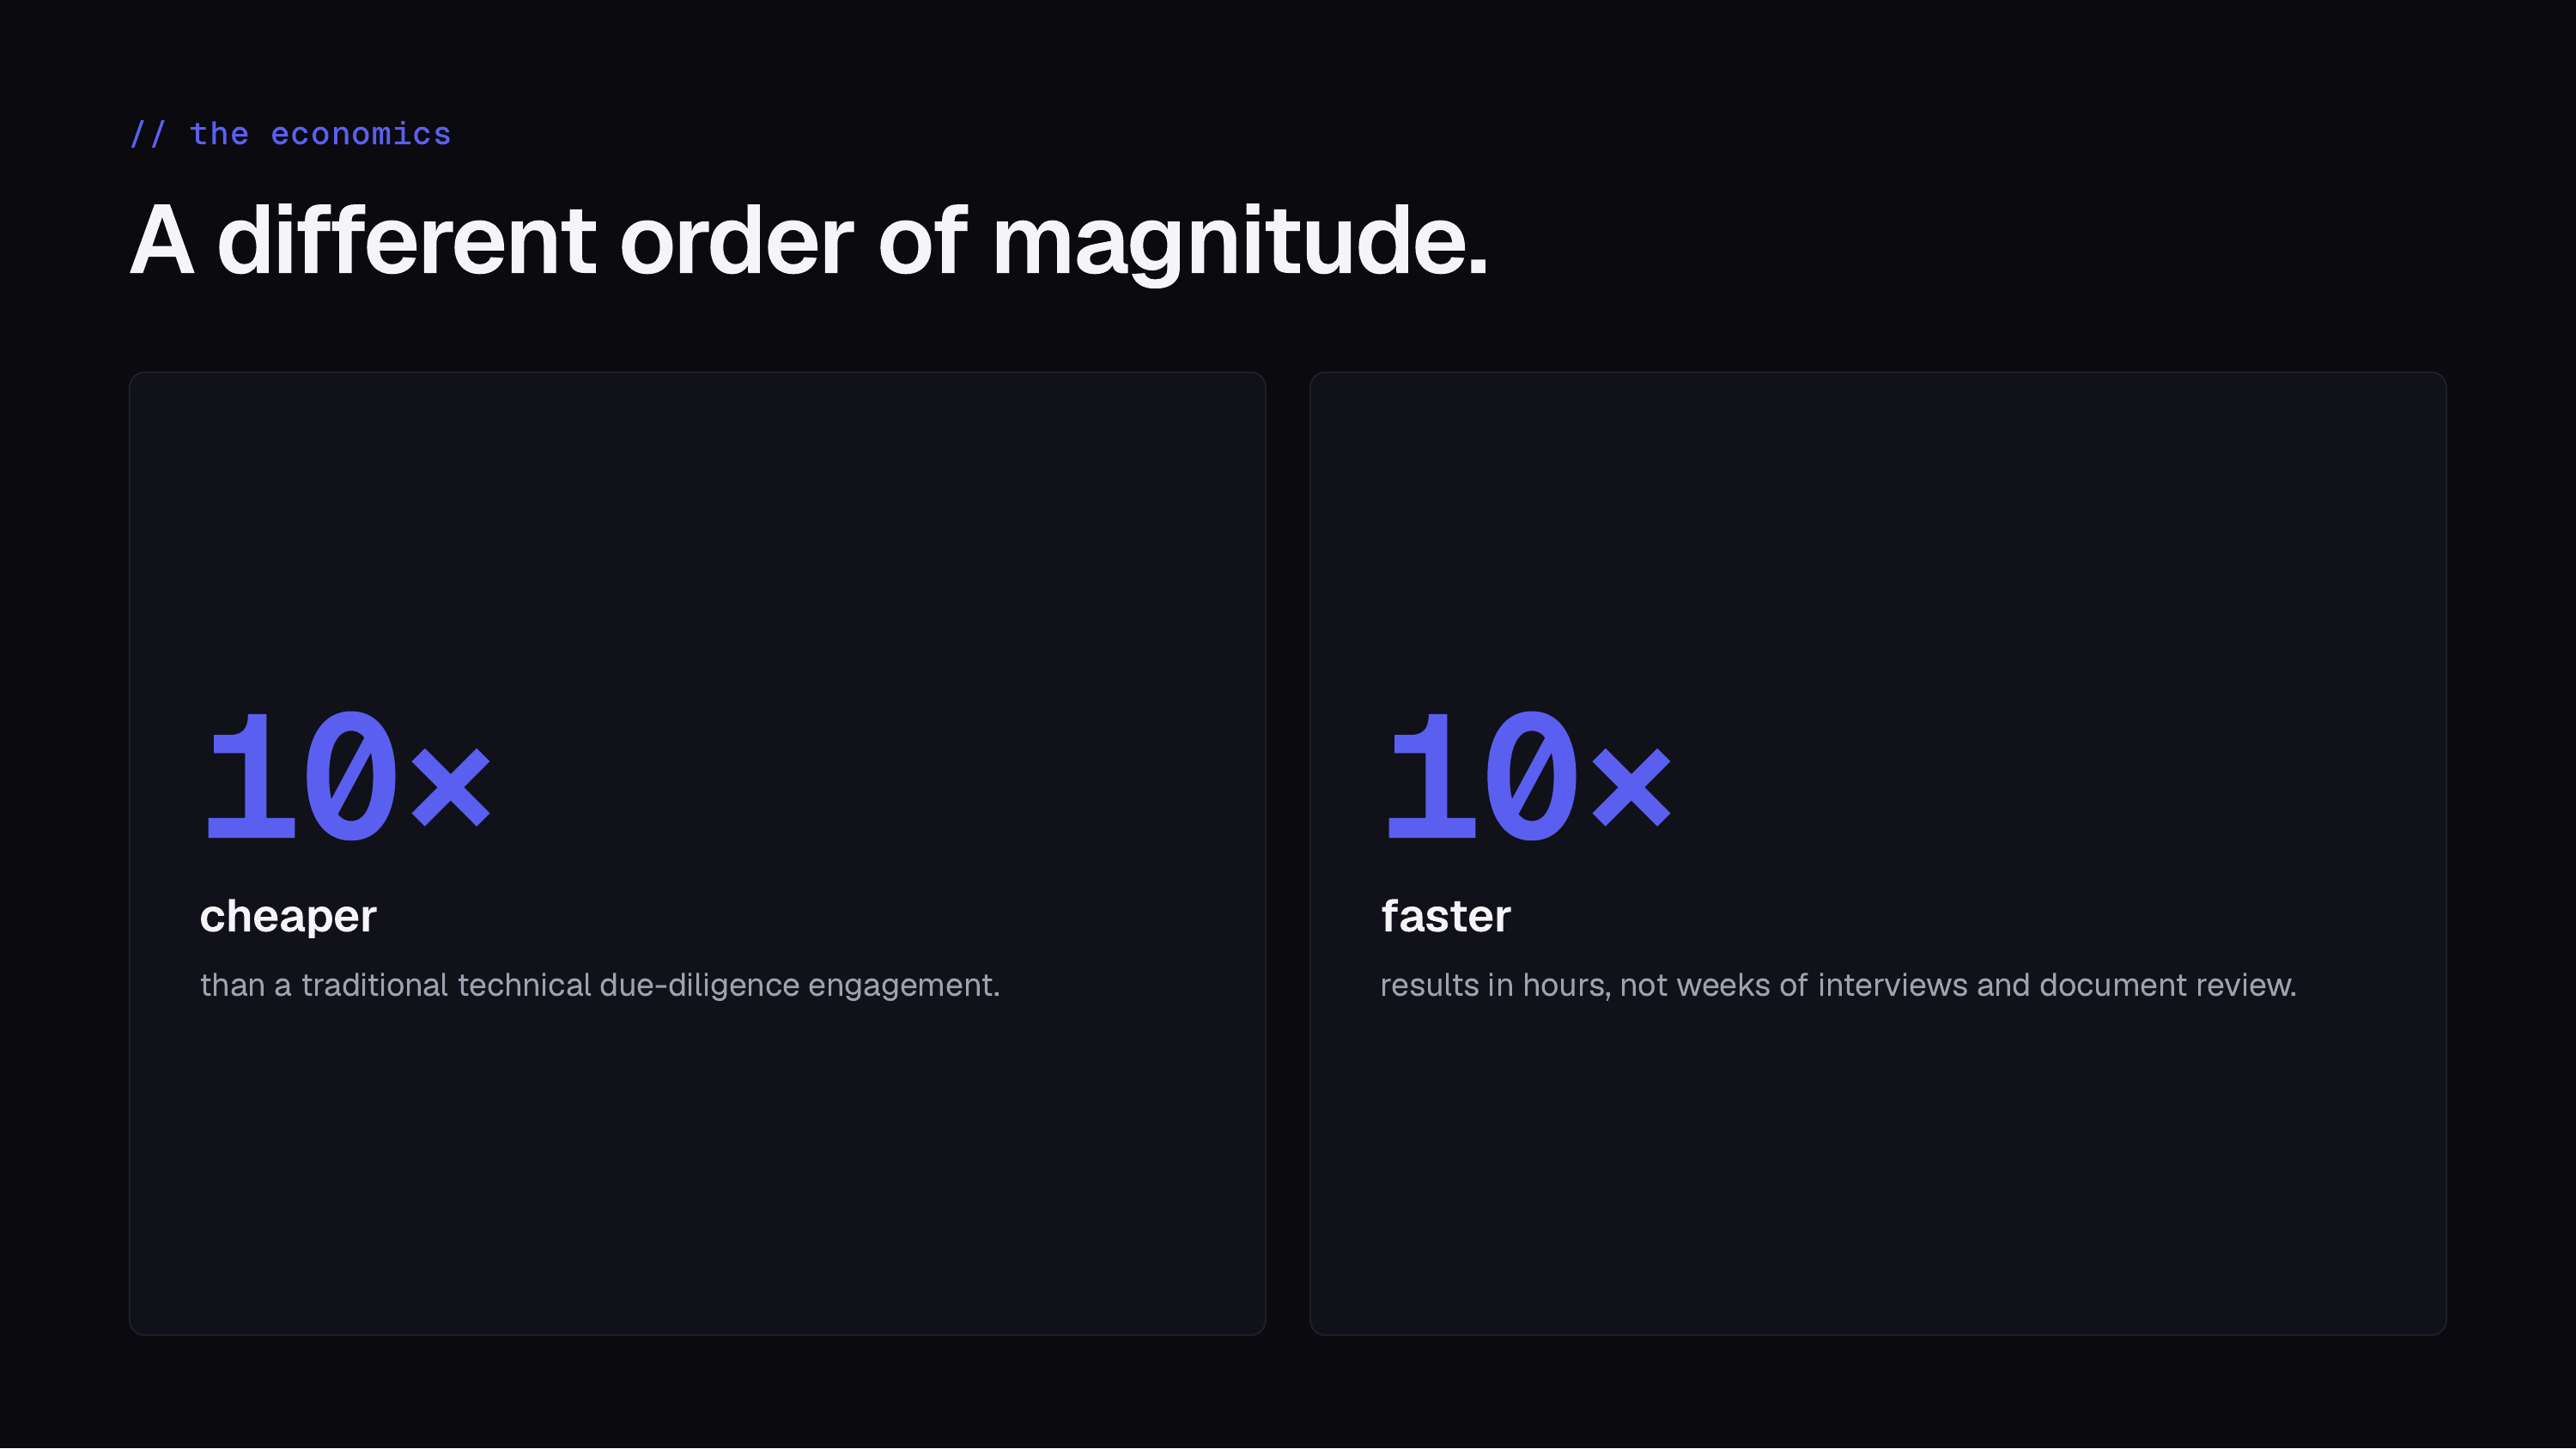
The result is a different order of magnitude: roughly 10x cheaper and 10x faster than a traditional technical due-diligence engagement. And unlike a one-off audit that goes stale the moment the consultants leave, it keeps running after close. The same benchmark that informed the deal tracks the portfolio company quarter after quarter, so you see whether the engineering thesis is playing out long before it shows up in the numbers.
Measure engineering before you wire the money, then keep measuring it after. Rank a live deal against the companies that actually returned your funds, and get a verdict in hours, not weeks.
Frequently asked questions
- What is engineering due diligence?
- Engineering due diligence is the part of technical due diligence that assesses how well a target company's engineering org actually ships, not just its architecture or security. Done well, it benchmarks output per developer, AI spend efficiency, bug load, and roadmap alignment against comparable companies, rather than relying on interviews and self-reported decks.
- How long does technical due diligence take?
- A traditional technical due-diligence engagement runs 4 to 6 weeks and $50,000 to $150,000, and produces a single point-in-time snapshot. An agentic audit that reads the codebase directly returns a benchmarked result in hours and keeps running after close.
- How do you benchmark a startup's engineering team?
- Score engineering output per developer (for example with ETV, Engineering Throughput Value) and rank it against companies at the same stage, ideally the realized winners that returned your fund, plus the public frontier. That turns 'is this a good team?' into 'where does this team sit against the best, and is the gap closing or widening?'