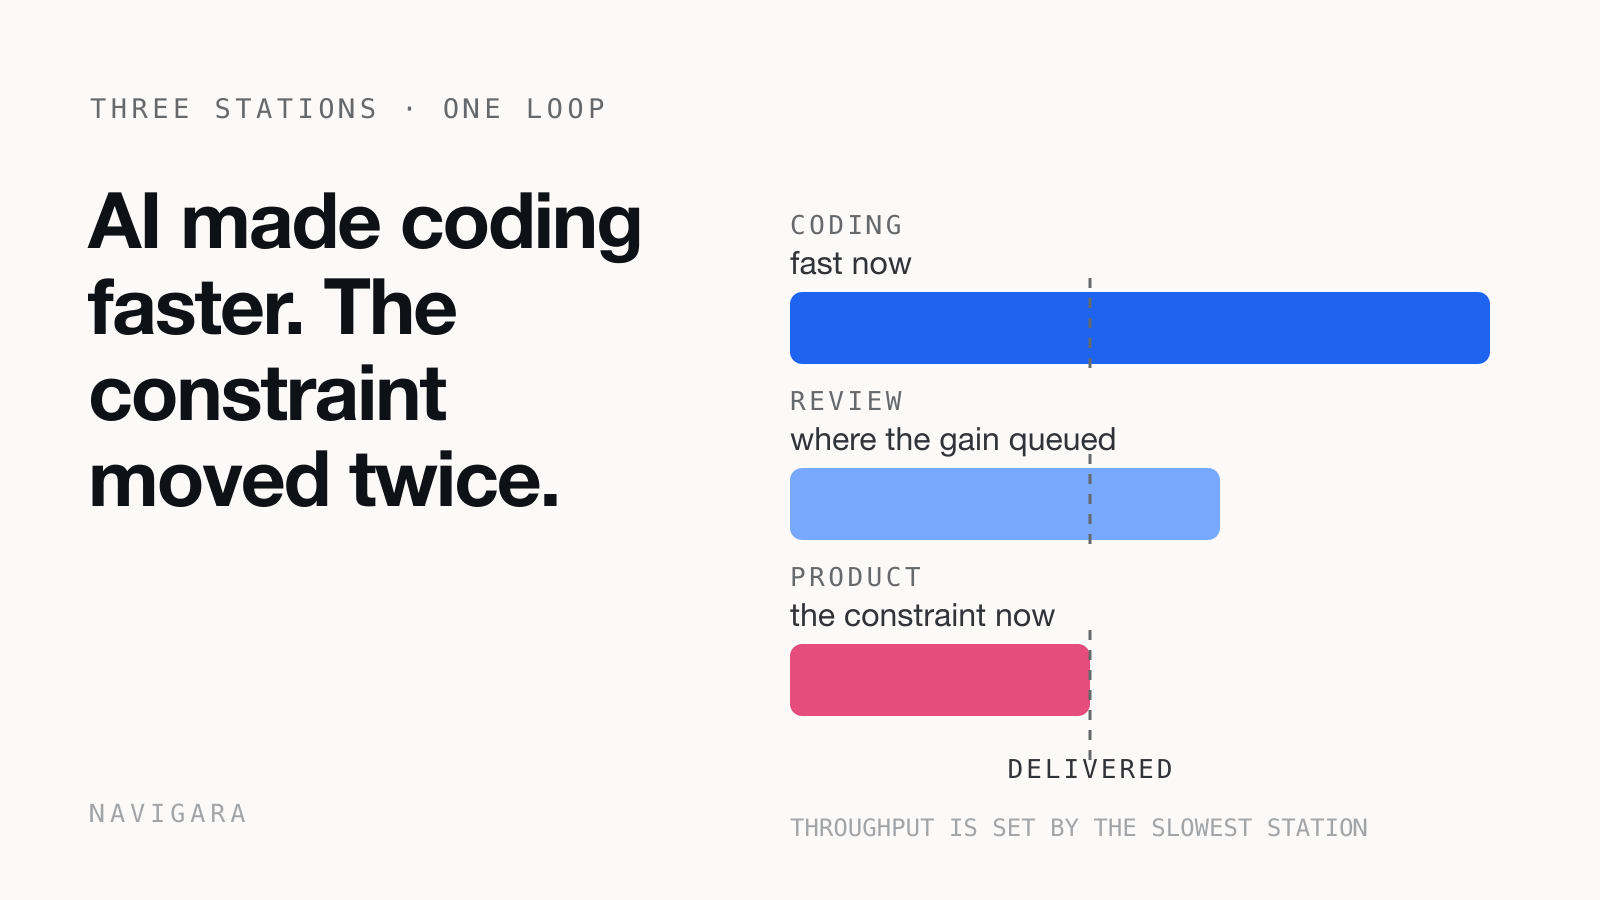
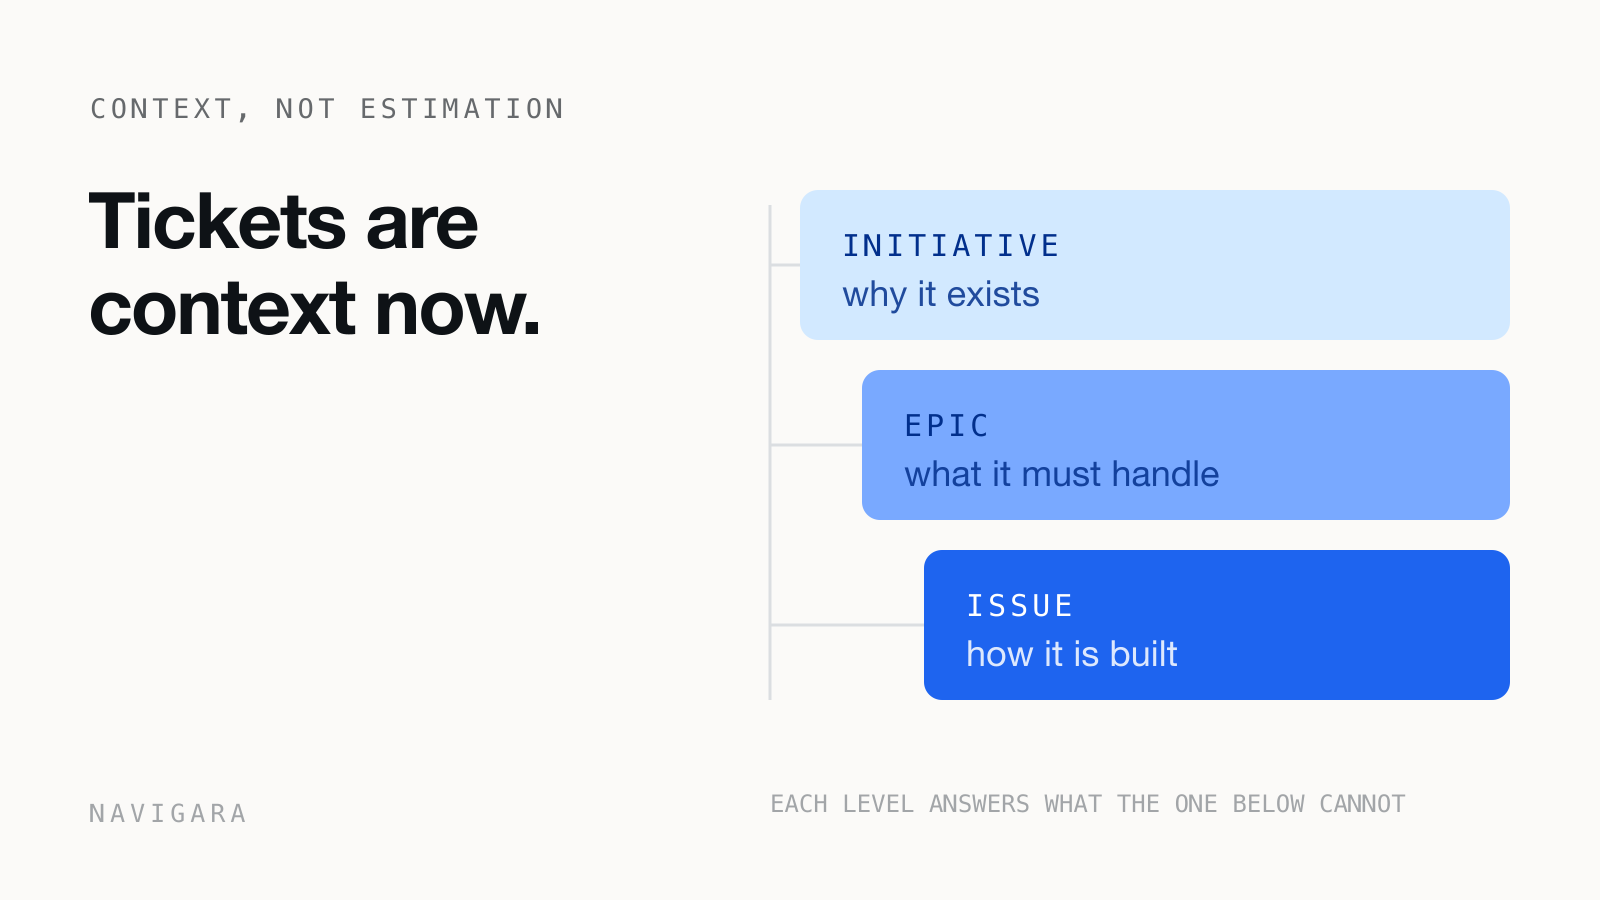
Three Ways to Manage Token Spend. Two of Them Backfire.
I talk to a lot of engineering leaders. Prague, London, New York, San Francisco, mostly companies between 50 and 1,000 developers. Whatever the call is booked for, it always ends on the AI bill.
Three patterns out there. I’ll go in the order I run into them, which is roughly the order companies move through them.
1. Flat per seat. Nobody reads the bill.
They bought Copilot seats at $19 a head two years ago, added Cursor, then Claude Code. At $19 nobody filed it as a cost decision. It sat next to Jira in the tooling line and no one asked questions.
Then pricing moved, and heavy users are now landing somewhere between $200 and $600 a month depending on how many agents they run in parallel. The bill stopped being flat while the mental model stayed flat. When I ask what they got for the money, the two answers I hear most are that the team likes it and that PRs feel faster. Both are probably true, and neither one survives contact with a CFO.
The people least worried about this often have the highest absolute spend, which took me a while to understand. $300 a month next to a €7,000 fully loaded monthly cost per developer is about 4% of that engineer, close enough either side of the exchange rate that it doesn’t change the answer, and treating 4% as noise is a defensible call. At 800 developers that 4% is €2.9M a year, still defensible in ratio terms, but now it’s a number somebody has to actually explain, and the habit of measuring it was never built.
2. Hard cap per seat. $2,000 a month, then $5,000 when they complain.
This is where most of the market is right now, and it’s the group I argue with the most.
Somebody in finance asks a completely reasonable question and the answer that comes back is a number. $2,000 per seat per month. Engineers push back, so it becomes $5,000. It feels like control, it goes in the budget, and it holds.
Then the engineers get to work on it. Things I’ve seen inside companies running hard caps:
- Senior people switching to a model that is roughly 10× cheaper per token for work that genuinely needed the strong one.
- Agents pulled off the long migration tasks where they earn their keep.
- A team putting two weeks into benchmarking local inference, about €5,000 of payroll chasing €1,500 a month of savings.
- One engineer who built an internal cost router on their own time because they found it interesting.
None of that was on the roadmap. It happened because you handed a very capable optimizer a target and they optimized it, which is the correct response to being given a target.
Caps also land unevenly, because token spend isn’t normally distributed. In the orgs where I’ve seen raw usage data, the heaviest 10% of developers account for something close to half the total. I want to be careful here, because there are two readings of that and I only believe one of them. The pessimistic reading is that 10% of your team is wasteful. The one that matches what I’ve actually seen is that those are the people running agents on migrations, test coverage and the unglamorous refactors, and their spend tracks the difficulty of what they picked up. A flat per seat cap throttles that group first and never touches the person doing $150 of autocomplete.
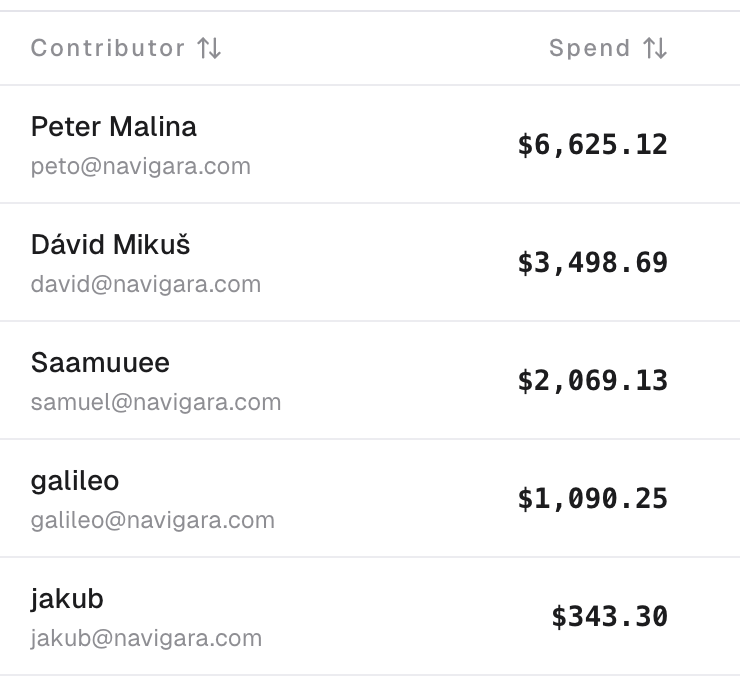
Ranked like that, the top row is nineteen times the bottom row and the conclusion writes itself. Cap the expensive one. Now add what each of them delivered and what a unit of it cost. Delivered work here is ETV, a per-commit score of how much substantive work actually landed, and unit cost is that divided into the spend. The ranking comes apart. The $6,625 at the top turns into $87.61 per ETV, second cheapest on the board. The cheapest row by spend, $343, is the most efficient at $24.04. And the row nobody would have looked at, $1,090 in fourth place, costs $467.83 per ETV, five times the top spender.
| Contributor | Spend | Share | Performance | AI spend / ETV |
|---|---|---|---|---|
| jakub | $343.30 | 2.4% | 10.3 ETV | $24.04 |
| Peter Malina | $6,625.12 | 47.0% | 75.6 ETV | $87.61 |
| Dávid Mikuš | $3,498.69 | 24.8% | 36.8 ETV | $95.00 |
| Saamuuee | $2,069.13 | 14.7% | 13.2 ETV | $156.87 |
| galileo | $1,090.25 | 7.7% | 0.90 ETV | $467.83 |
Two caveats before anyone takes that as a finding. It’s five people at one company, and the company is mine, so read it as an illustration rather than a study.
The second one matters more. That bottom row invites an obvious objection: 0.90 ETV against $1,090 might just mean the month went into work the metric scores badly. Infrastructure, oncall, a spike that got thrown away, a week of interviewing. The objection is right, and it’s the reason this screen is a trap and not a scorecard. A ratio next to a person’s name tells you nothing about what that person was handed. It only looks like it does.
So the cap gets aimed at the biggest number on a screen that never showed unit cost, which is how you end up throttling your most efficient spender and leaving the expensive one alone.
And here’s the part that bothers me. I have never met a CTO who sat down and decided their AI budget should be the binding constraint on their roadmap. But that’s what a per seat cap is, and it usually got set in a spreadsheet by someone who wasn’t in the planning session.
If you’re an EM and the cap isn’t yours to remove
Most of the people reading this can’t delete the cap. You didn’t set it. So don’t argue for a bigger number, because that’s a budget conversation and you’ll lose it.
Argue for an exemption on one workstream instead. Pick the piece of work where agents obviously pay off, usually a migration or a test coverage push, something with a date attached that everyone already wants moved forward. Take the cap off for that team for six weeks and instrument two things: what the tokens cost, and what shipped that wouldn’t have. Then go back with the ratio.
That’s a conversation about delivery with a cost attached, which is a conversation finance is used to having. Asking for a higher ceiling is a conversation about cost with delivery implied, and nobody funds an implication.
3. Dynamic. Spend follows delivery.
We’re piloting this with a couple of companies at the moment, so treat what follows as an argument rather than a proven pattern.
They don’t cap. They watch a ratio: what did we spend, and what did we ship.
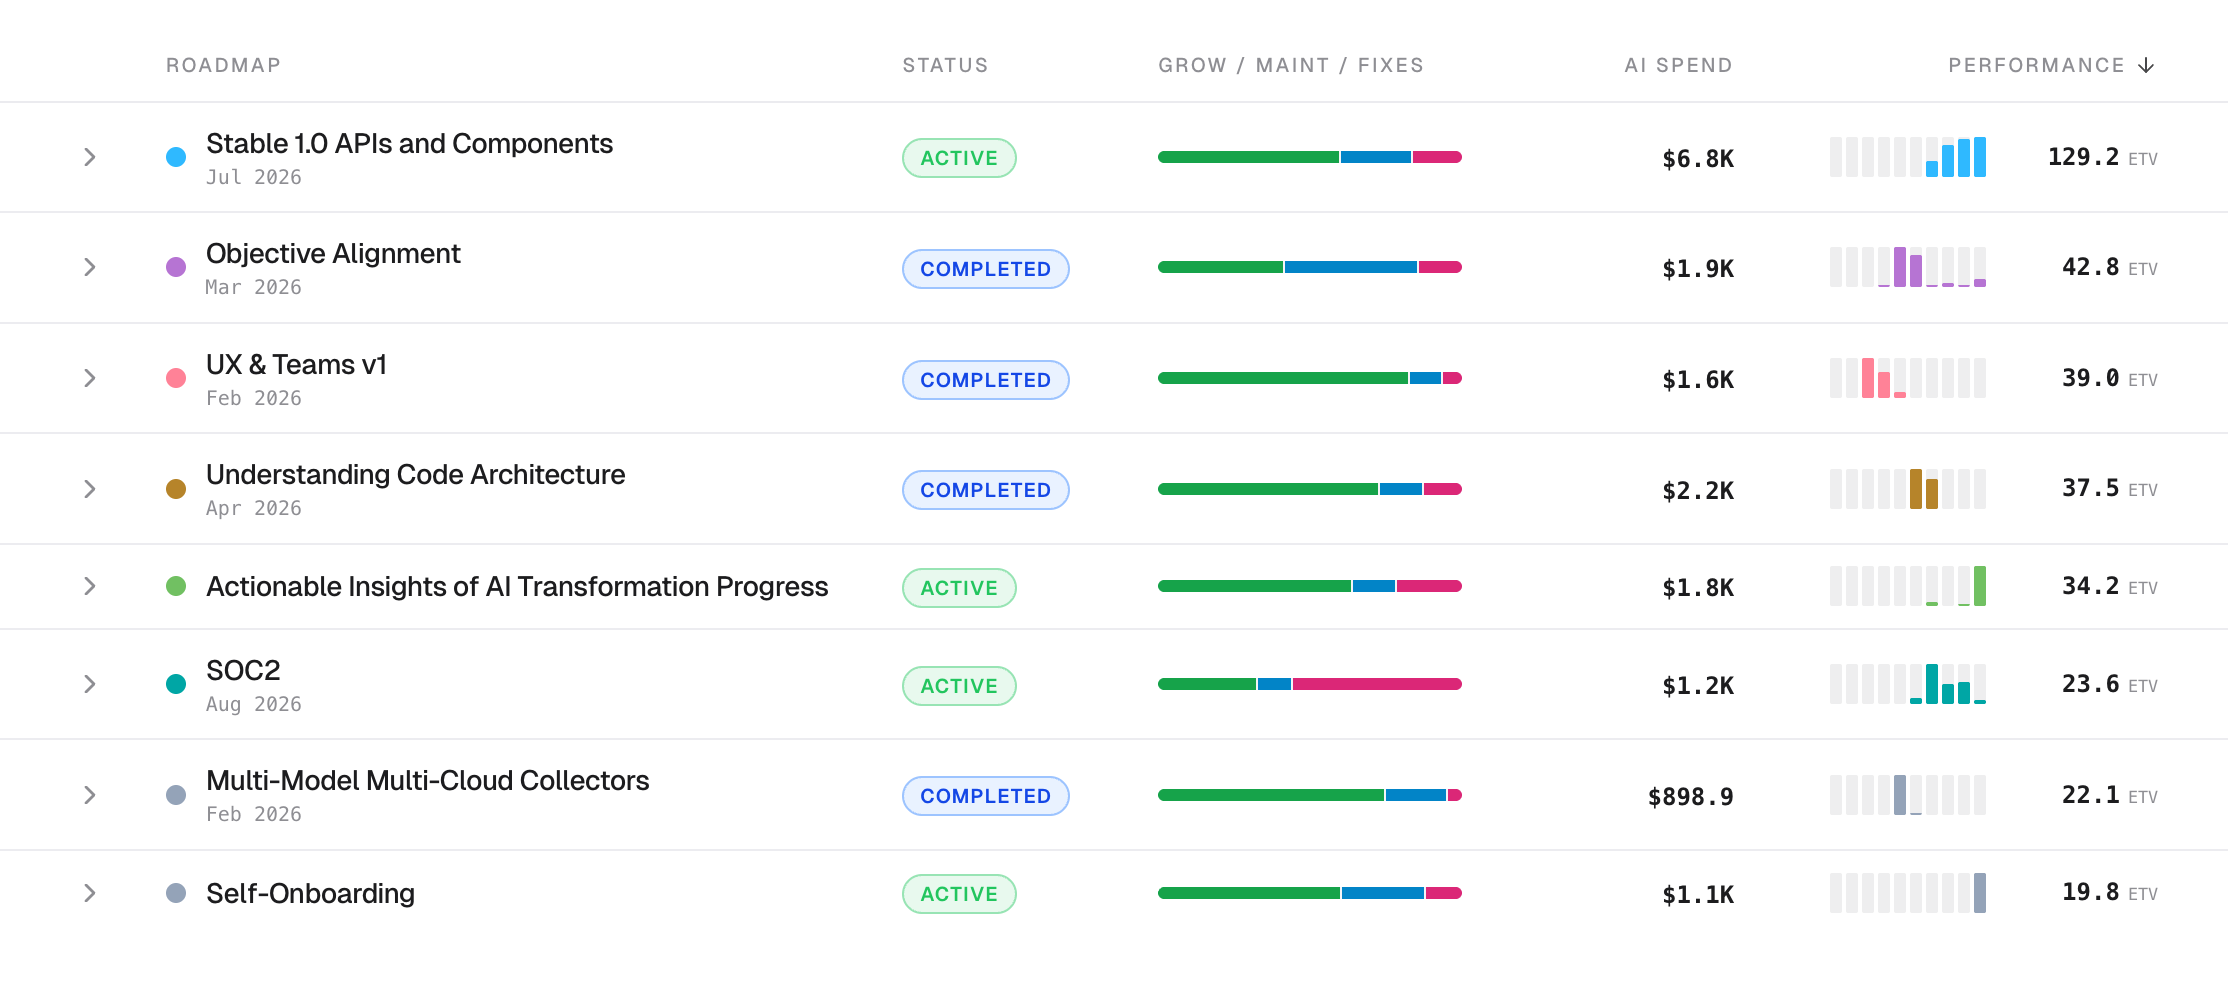
The screen at the top of this piece is that ratio at the level it belongs. Spend against delivered ETV, per roadmap item, with the features, maintenance, tests, docs and fixes split sitting next to it. That’s our own data, and it’s the version of these two columns I’d put in front of a board.
The arithmetic is why it works. A team of five burns €6,000 of tokens in a month and closes out a migration carrying three sprints of estimate. The ETV on those commits backs the estimate up: the work scored high, so this was hard delivery rather than a number padded at planning. Three sprints of five engineers is about 30 developer weeks, six calendar weeks for the team, call it €50,000 of loaded payroll. So you spent something like 12% of the labour cost to pull the work in.
That number is softer than it looks and I’d rather say so than have you catch it. It assumes the migration wouldn’t have shipped anyway, which is never fully knowable. Some of that 12% bought speed, some of it bought work that was going to happen regardless. Even at half the effect it’s an easy trade, which is the actual point. You don’t need precision to make this call, you need the two columns next to each other.
Same €6,000 on a feature nobody sequenced and these teams still don’t touch the token budget, because the spend was never the problem. The roadmap alignment was.
Two things make this hard, and one of them is a trap
The hard part is that the second half of the ratio doesn’t exist in most orgs. Everyone has the spend number, per user, per day, down to the cent. Almost nobody has a measure of output they’d defend in a room, and the last time our industry tried we got lines of code and story points, so the low appetite is earned.
The trap is what you do with output data once you have it. If you break down value per dollar by individual and put it on a dashboard with names on it, you’ve built a worse cap than the one you removed, and your engineers will optimize that number instead of the roadmap. Same failure, new metric. Keep it at team and workstream level. The question worth answering is whether a workstream converts spend into delivery, not which developer has the best ratio this sprint.
That gap in output measurement is why my company exists, so discount my enthusiasm accordingly.
The tradeoff, in numbers
- Flat per seat: 2 to 4% of engineering cost today, unknown return, no argument available when finance asks.
- Hard cap: spend fixed at $2,000, delivery capped at whatever $2,000 buys, and the cut aimed by a screen that never showed unit cost.
- Dynamic: roughly 12% of labour cost to compress six weeks of roadmap, on a number you can defend upward.
What to do this week
Caps are a phase, the same way early cloud cost management was a phase. For a couple of years the answer to a big AWS bill was turning off instances on Friday afternoon. FinOps didn’t arrive because anyone wanted to spend less. It arrived once someone connected spend to what it produced, and at that point the conversation became unit economics instead of cutting. Tokens look like they’re on the same track, maybe two years behind.
The test for which of the three you’re in takes an afternoon, or at least the first half of it does. Pull last month’s AI spend by team, put it next to what those teams delivered against the roadmap, and use delivered work rather than commit counts.
Most people have the spend column by lunch. The second column is where it stalls, and that’s the part we automated. ETV scores delivered output per commit and sits next to your AI spend, read only, so the ratio is a dashboard instead of a reconstruction exercise somebody redoes every month. If you’d rather skip the afternoon and just see what your own ratio looks like, that’s a short conversation.
Either way, run the test. If the two columns don’t line up, a cap won’t fix it. It just makes the problem quieter.
Frequently asked questions
- How should we budget for AI coding tools per developer?
- Budget against delivery, not against a per seat ceiling. Heavy users now land between $200 and $600 a month, which is roughly 2 to 4% of a fully loaded developer cost, so the ratio question that matters is what a team’s token spend returned in delivered roadmap work, not whether an individual crossed a line in a spreadsheet.
- Why do hard caps on AI token spend backfire?
- A cap is a target, and engineers optimize targets. In practice that means senior people downgrading to cheaper models for work that needed the strong one, agents pulled off long migrations where they pay for themselves, and weeks of payroll spent chasing small monthly savings. A flat per seat cap also throttles the heaviest 10% of users first, and those are usually the people running agents on migrations, test coverage, and refactors.
- What is a dynamic AI budget for engineering?
- No cap, and a watched ratio instead: what the team spent on tokens versus what it delivered. A team of five burning $6,000 of tokens to close out a migration carrying three sprints of estimate spent about 12% of the loaded payroll cost to pull that work in. Spend on unsequenced work is a roadmap alignment problem, not a budget problem.
- How do you measure engineering output next to AI spend?
- Most orgs have the spend column to the cent and no output column they would defend in a room. ETV (Engineering Throughput Value) scores delivered output per commit, so spend and delivery sit side by side. Keep it at team and workstream level: a per-developer value-per-dollar leaderboard is a worse cap than the one you removed.