What Is Engineering Throughput Value (ETV)? Definition and Methodology
Engineering Throughput Value (ETV) is a unit of engineering output. One ETV is a fixed amount of delivered engineering value, scored the way a senior engineer would judge a change: not how much code moved, but how much it meant.
It exists because the metrics most teams still report, lines of code, commit count, story points, all measure activity. Activity went up the moment AI tools arrived. Value is the harder question, and it is the one leaders actually care about. ETV is built to answer it in a number you can compare across teams, repositories, and time.
The one-line definition
ETV is the standardized unit of substantive engineering output, produced by reading each merged change in a codebase and scoring what it accomplished. Higher ETV means more real work shipped, regardless of how many commits, lines, or tickets it took to get there.
Why a new unit was needed
Every legacy proxy breaks under AI. Lines of code reward verbosity, and AI writes a lot of lines. Commit count rewards frequency, and AI commits often. Story points are negotiation tools, and nobody can estimate AI-assisted work reliably, which is part of why many teams are dropping them. Self-reported surveys are recollection, and they miss contractors entirely.
None of these measure whether the output got more valuable. They measure whether it got more numerous. ETV is designed to separate the two.
How a change is scored
ETV is computed per merged change, file by file, from the diff and the surrounding code. Five factors set the weight of each change:
- Complexity — the structural weight of what changed, not its length.
- Engagement — how dense and intricate the surrounding code is. A targeted edit inside a complex, load-bearing area scores higher than the same edit in boilerplate.
- Architecture — where the change sits in the codebase’s feature graph. Work on deeply connected features carries more weight than work on isolated corners.
- Decay — a discount that strips credit from mechanical refactors, self-rewrites, and copy-paste patterns, so churn does not inflate the score.
- Multiplier — an amplifier for fixes to costly bugs in old or frequently-modified code, where the value of getting it right is highest.
The weighting is deterministic: the same diff produces the same score on every run. A language model is used only to classify ambiguous work into categories, not to invent the number. There is no black box guessing a score.
Growth, Maintenance, and Fixes
Every change is also classified into one of three buckets, so ETV is never a single opaque total:
- Growth — new functionality and product surface area.
- Maintenance — refactoring, testing, dependency updates, and documentation.
- Fixes — bug corrections, traced back to the commit that introduced the problem.
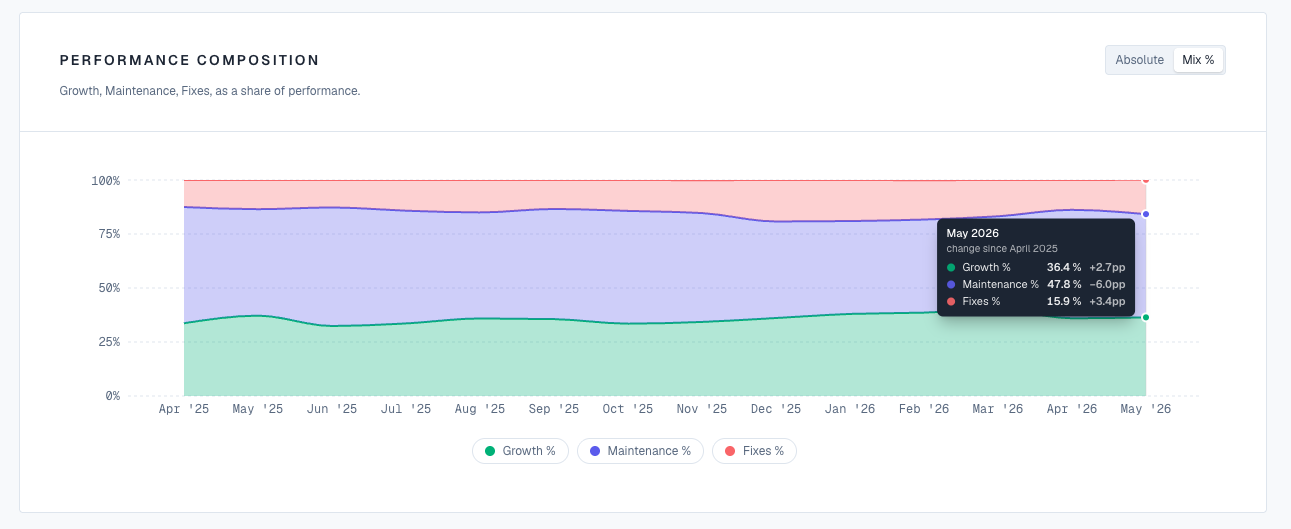
This split is what makes ETV honest about AI adoption. Shipping faster is only good if the work mix stays healthy. If fixes and maintenance balloon while growth stalls, you are paying the tools to clean up after the tools, and the category breakdown shows it.
What ETV reads, and what it ignores
ETV is derived from commit history alone. No project-management tools, no surveys, no self-reports. It reads git diffs and commit metadata, analyzes code structure across more than a dozen languages with full parsing (Go, Java, JavaScript, TypeScript, Python, Rust, and others), and infers a feature graph from how the code is organized.
It deliberately ignores noise that would distort the score: generated code, lockfiles, binaries, and minified files are excluded. The full methodology is public, so the number is auditable rather than asserted.
What ETV is not
ETV is not a surveillance metric for ranking individuals on raw volume, and it is not a replacement for judgment. It does not count keystrokes, hours, or tickets. It is closest in spirit to DORA, but where DORA measures the pipeline (how often you deploy, how fast, how often you fail), ETV measures the content of the work itself. The two are complementary: DORA tells you how the factory runs, ETV tells you what came off the line.
Where ETV shows up
Because it is a stable unit, ETV composes into the measurements leaders actually ask for:
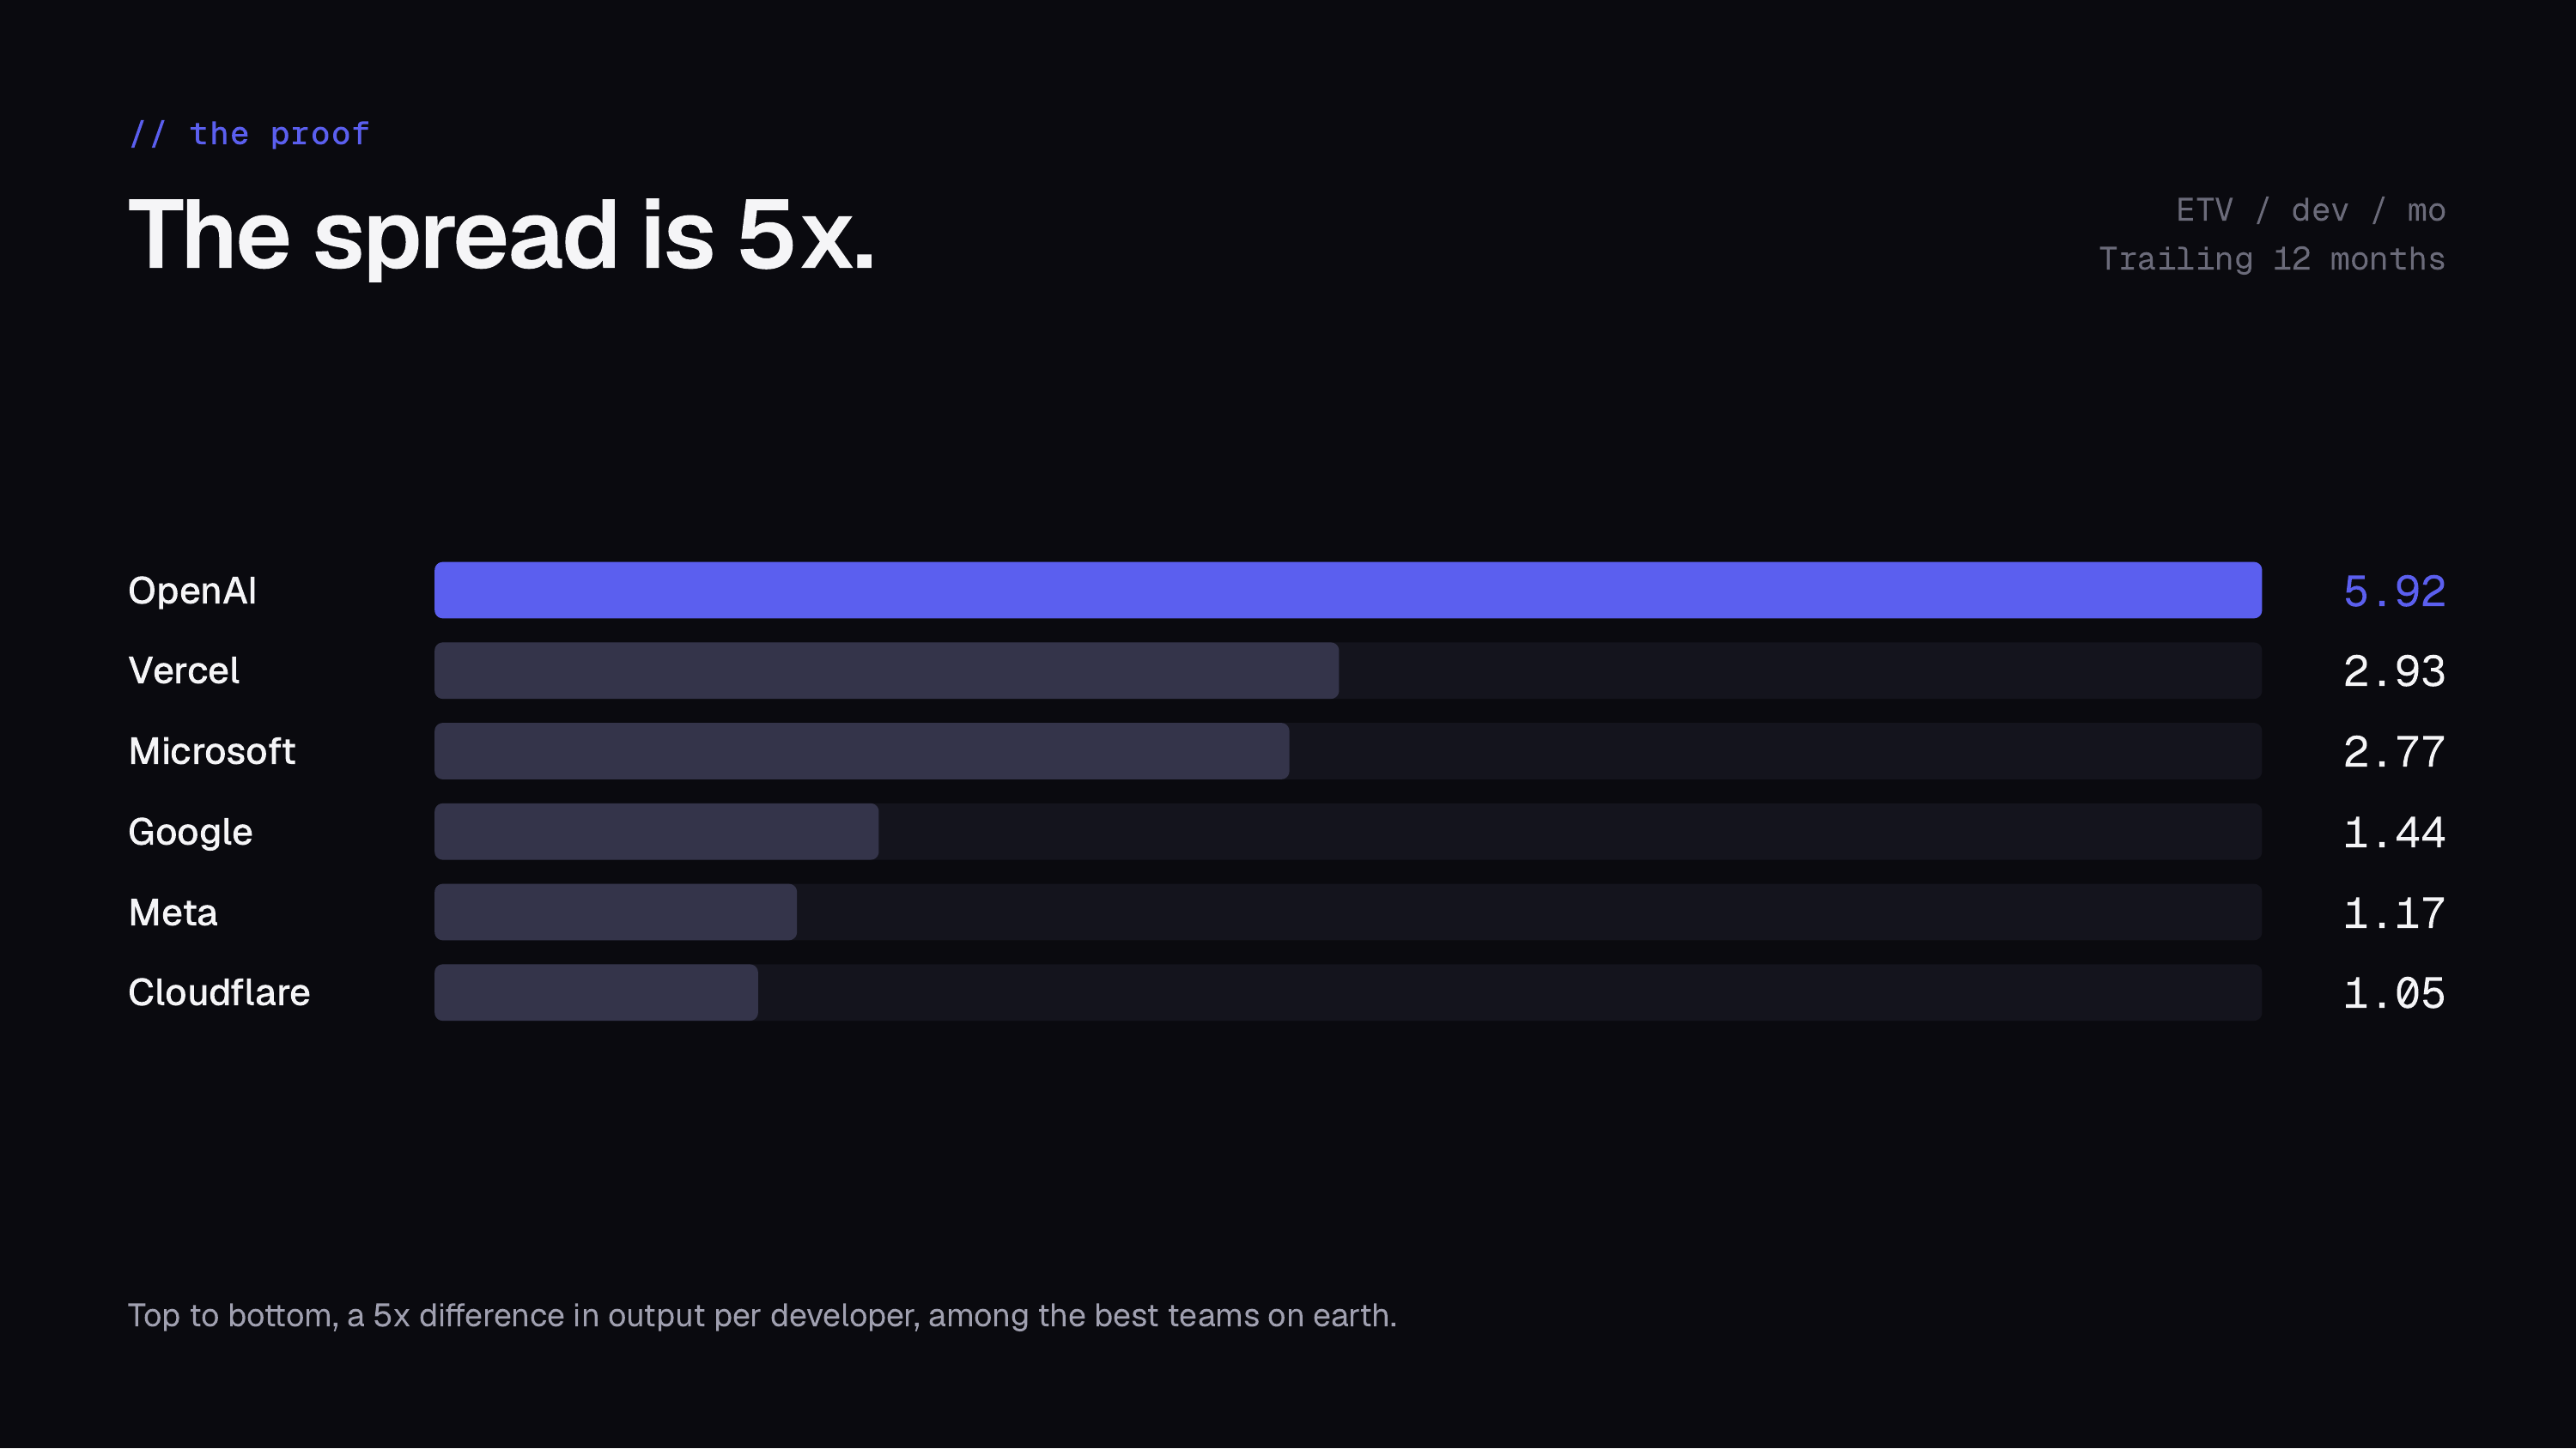
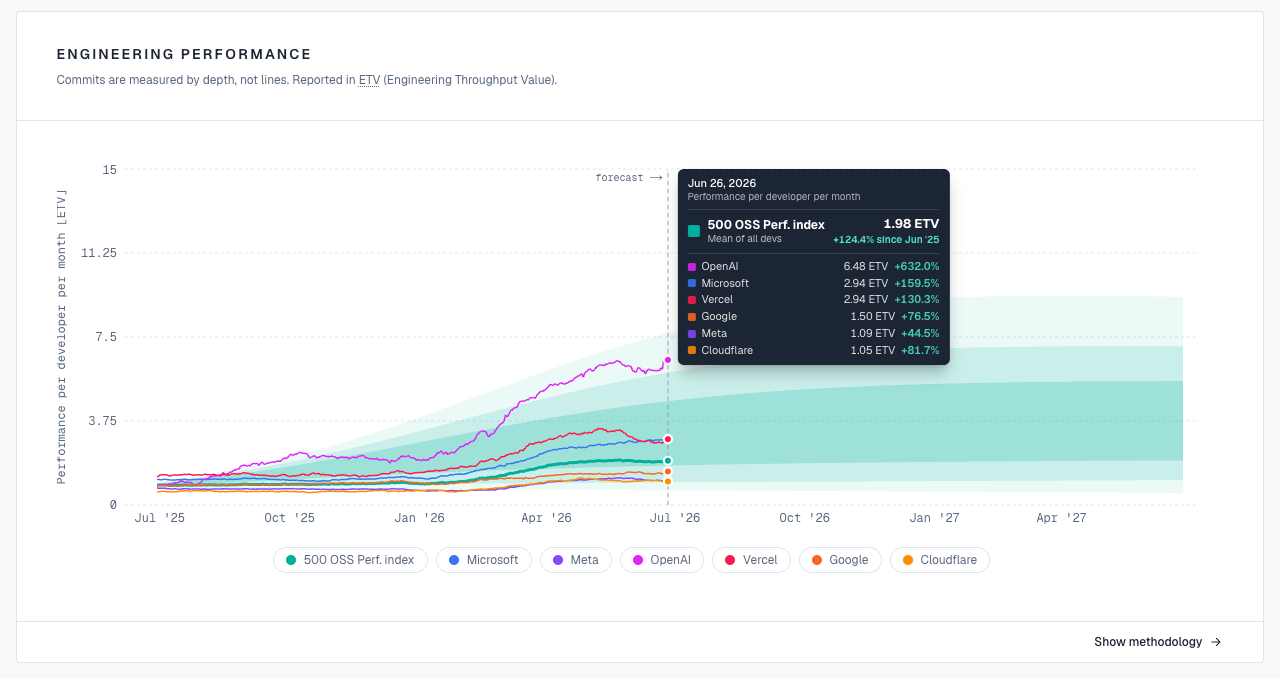
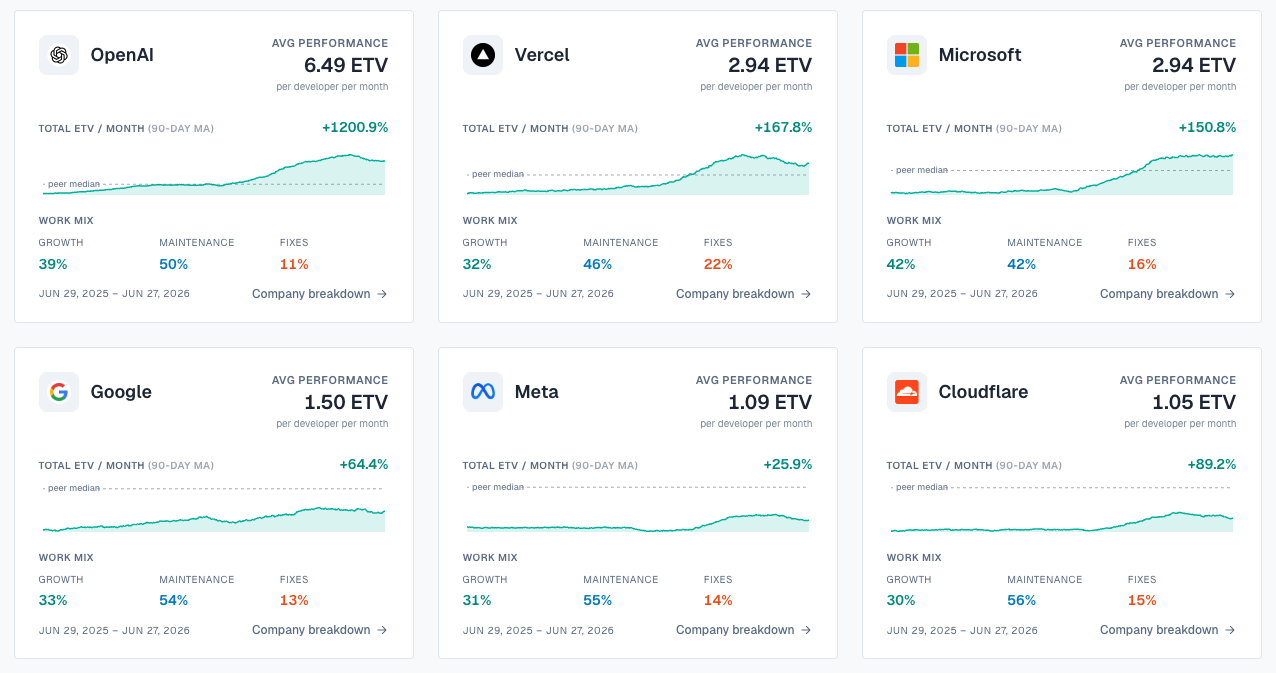
- Performance over time. Benchmark current ETV per developer against the team’s own pre-AI baseline to see whether output genuinely rose. This is how we found that performance per engineer doubled across six big-tech companies.
- Cost per ETV. Divide AI tooling and token spend by ETV shipped to get the unit economics of your AI investment, which is the basis for proving ROI on AI tools.
- Roadmap alignment. Measure how much delivered ETV lands on roadmap priorities versus unplanned work.
- Public benchmarks. The same engine runs live in the 500 OSS Performance Index, scoring real output across the open-source repositories of the largest tech companies.
The short version
ETV turns “are we actually getting more done?” from a debate into a number. It reads the code, scores what each change accomplished, splits it into growth, maintenance, and fixes, and reports it against a baseline. Once output has a unit, everything downstream, ROI, efficiency, alignment, becomes arithmetic instead of opinion.
Frequently asked questions
- What is Engineering Throughput Value (ETV)?
- ETV is a standardized unit of engineering output. One ETV is a fixed amount of delivered engineering value, scored by reading each merged change in a codebase and judging what it accomplished, the way a senior engineer would, rather than counting lines of code, commits, or story points.
- How is ETV calculated?
- ETV is computed per merged change, file by file, from the git diff and surrounding code. Five deterministic factors set each change's weight: complexity, engagement (density of the surrounding code), architectural position in the feature graph, a decay discount for mechanical churn and self-rewrites, and a multiplier for fixes to costly bugs. The same diff always produces the same score; a language model only classifies work into categories, it does not invent the number.
- How is ETV different from DORA metrics?
- DORA measures the delivery pipeline: deploy frequency, lead time, change-failure rate, and MTTR. ETV measures the content of the work itself, how much substantive value each change delivered. They are complementary: DORA tells you how the factory runs, ETV tells you what came off the line.
- What data does ETV use?
- ETV is derived from commit history alone, with no project-management tools, surveys, or self-reports. It reads git diffs and commit metadata and parses code structure across more than a dozen languages, while excluding generated code, lockfiles, binaries, and minified files so churn does not distort the score.