How to Prove ROI on AI Tools in Engineering
Most teams can’t tie engineering directly to revenue. Fair. So you measure the next best thing: whether AI tools are shipping your roadmap.
Four questions:
- Are AI tools shipping faster?
- Faster at what?
- What did that speed cost?
- Did it land on the roadmap at all?
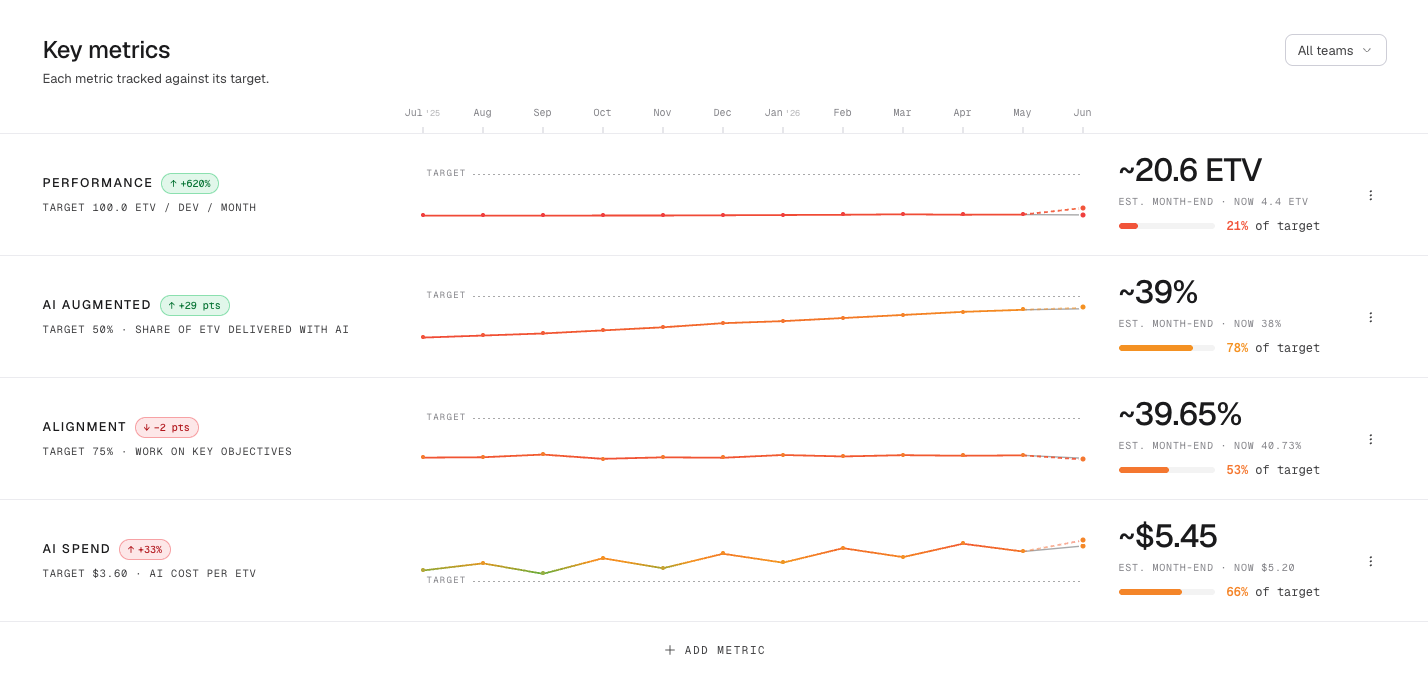
1. Performance change YoY
Velocity won’t work here. It runs on self-estimates, and nobody can estimate Claude Code work. Most teams are dropping story points anyway.
So we measure real engineering performance now vs the year before AI adoption. It took 18 months to build the unit for it: ETV, Engineering Throughput Value. Performance scored the way a senior engineer would score it.
Result: this team is 80% faster than a year ago.
2. Faster at what?
80% faster means nothing until you know the category. Bug fixes? Maintaining AI slop? Or actual features?
Good AI adoption keeps the bug and maintenance share flat. If those balloon, you’re paying the tools to clean up after the tools.
3. Cost per output?
Connect performance to spend. That 80% cost $25k last month in tooling. It works out to $200 per ETV shipped to production. That means they’re efficient with token spend and not wasting money on bad prompting, for example.
4. Roadmap alignment
The part everyone skips. Was any of this on the roadmap? Or did engineers finally build the things they always wanted to build, because now they can? Connect the performance and the story behind each commit to Jira or Linear, and you can see it:
- 40% went to roadmap work
- 15% went to tickets with no roadmap link
- 45% was unaligned
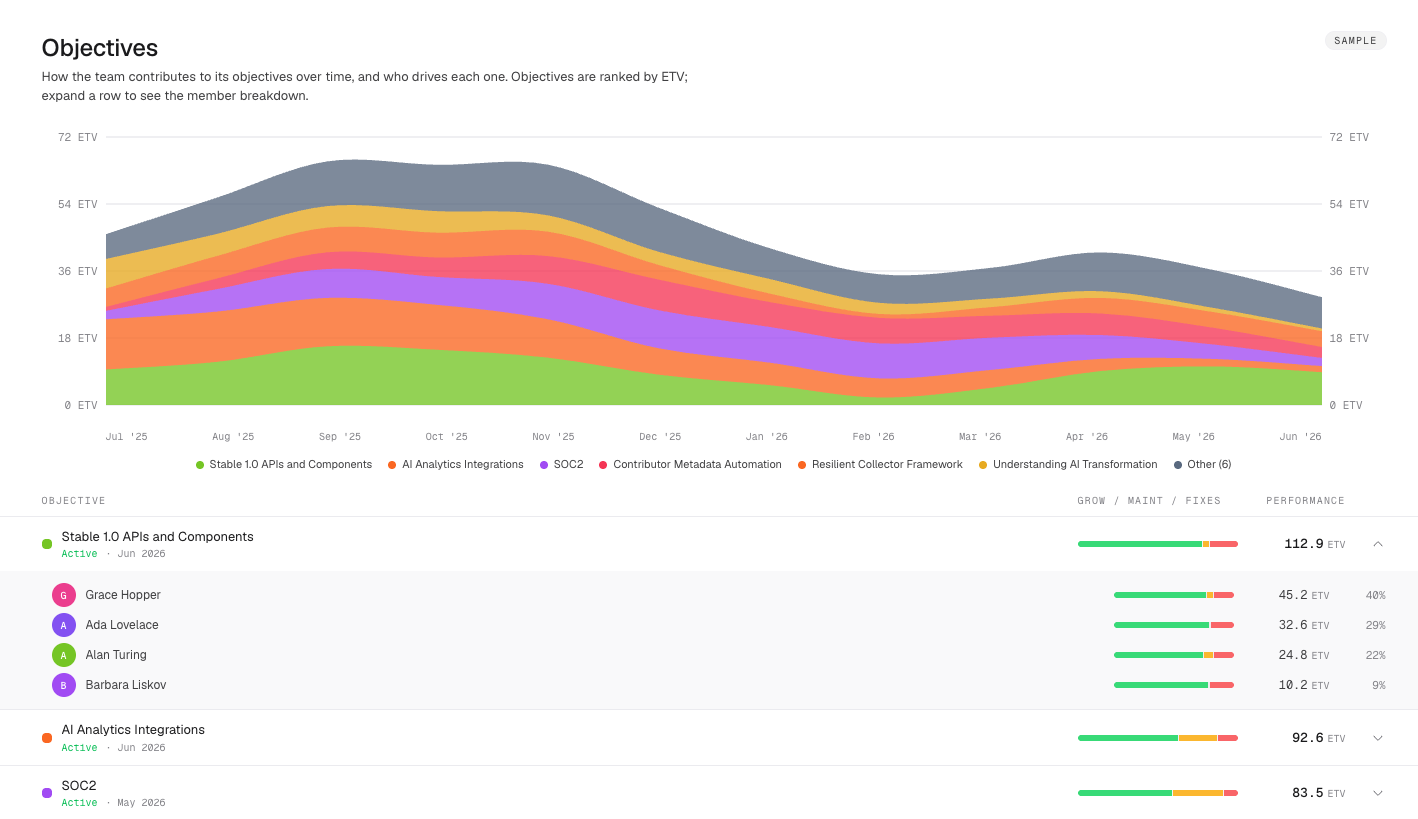
45% unaligned isn’t automatically bad. But you should definitely look into it and see what they’re building. Usually it’s a process problem.
This is also why overall speed and roadmap speed aren’t the same number. The team is 80% faster across all work, but only part of that lands on the roadmap.
Put it together and you get an actual ROI statement:
After adopting these seven AI tools, the team is 80% faster. Bug and maintenance load has remained steady. Tooling costs $25k per month, and the team is efficient with token spend at $200 per ETV. Roadmap delivery is 36% faster than a year ago. Plan well, and that becomes revenue.
One caveat. To keep this positive, I’m only walking through the case where AI adoption is working. You’d be surprised how often we see the exact opposite: high token burn, roadmap delivery flat.
Frequently asked questions
- How do you prove ROI on AI coding tools?
- Tie engineering performance to the roadmap. Measure how much faster the team ships real work year over year using a unit like ETV, check that bug and maintenance load stays flat, divide tooling cost by output to get a cost per unit shipped, and confirm how much of that output actually lands on the roadmap.
- What is Engineering Throughput Value (ETV)?
- ETV is a per-commit measure of engineering output, scored the way a senior engineer would judge the difficulty and impact of each change. It lets you compare performance year over year instead of relying on story points or self-estimates.
- Why not just use velocity or story points to measure AI impact?
- Velocity runs on self-estimates, and nobody can reliably estimate AI-assisted work. Most teams are dropping story points anyway. Scoring the real complexity and impact of shipped code is more honest and stays comparable over time.