Performance per Engineer Doubled at Six Big Tech Companies. Here's How It Was Measured.
Lines of code didn’t see it. PR count didn’t see it. The repos did.
TL;DR: A new measurement engine was run across 676 OSS engineers at Cloudflare, Vercel, OpenAI, Google, Meta, and Microsoft over five quarters. Performance per engineer rose 116% year over year. The interesting part is not the headline. LOC, PR count, story points, DORA. None of them produce a number that holds up under AI. So we built one that does.
Why Is Everyone +30% Faster and Nobody Can Show the Math?
Every vendor in the inbox right now is selling a productivity number. Cursor, Copilot, Claude Code, . None of them can show the math.
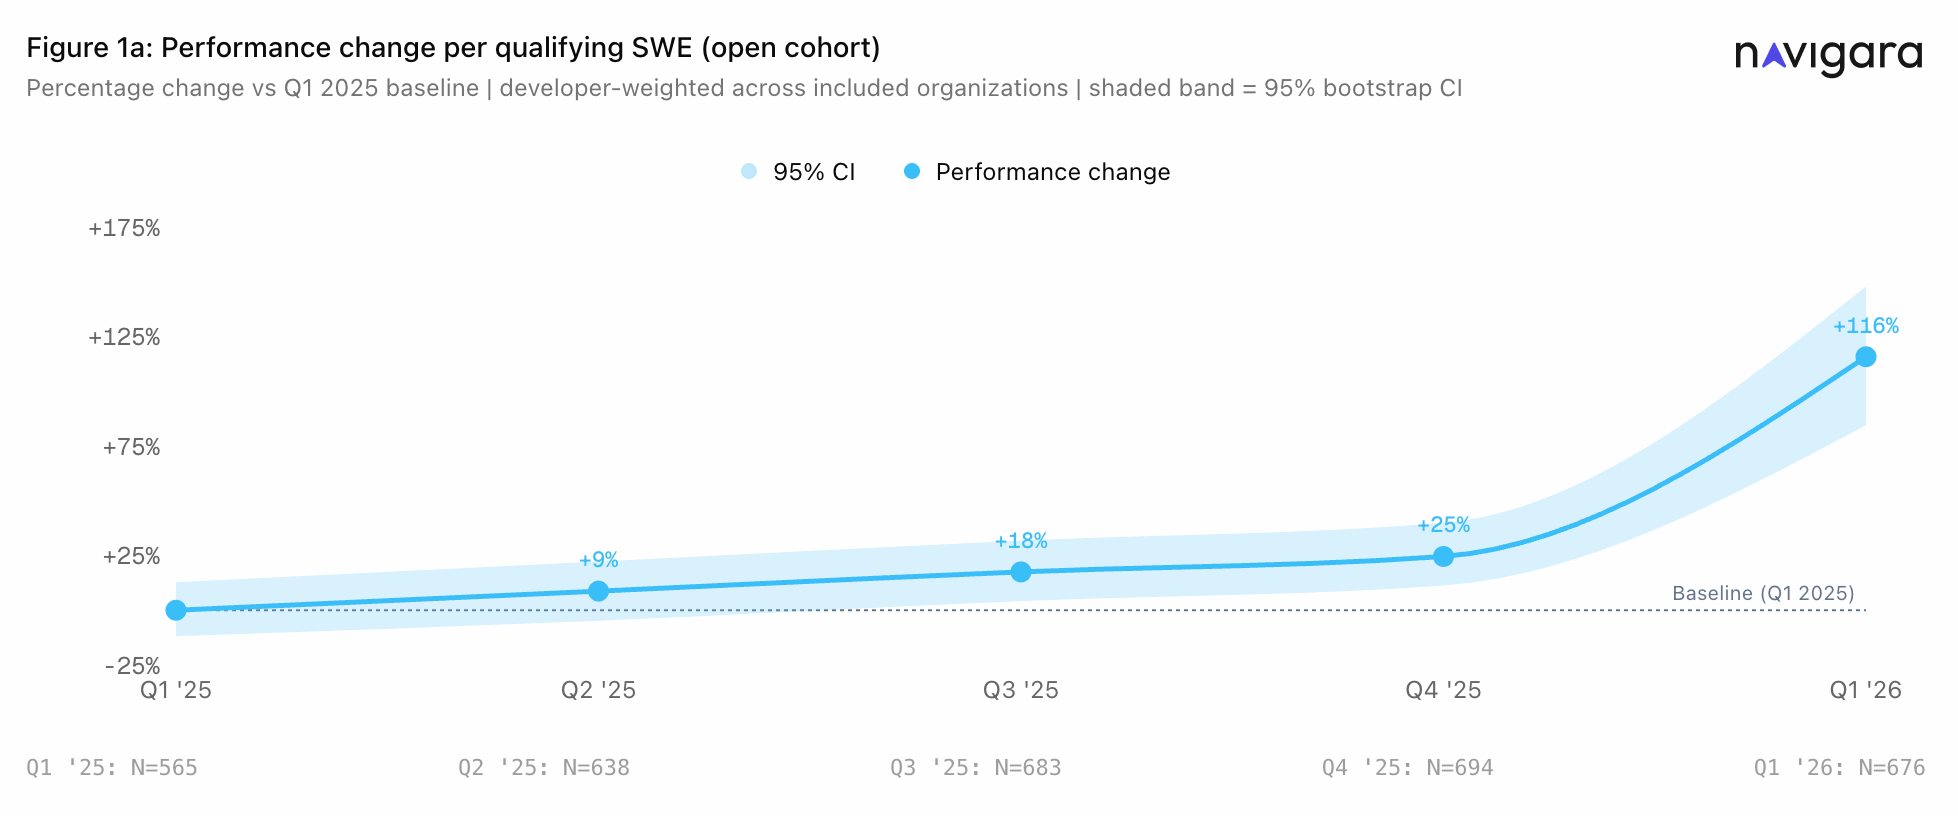
The analysis was run by Navigara, a team building engineering measurement tooling, and published as an open-methodology research paper. Five quarters. Six organizations. 676 engineers. One shared axis. The headline finding: performance per engineer rose 116% year over year [1].
The headline matters less than how it was reached. Below is what was measured, against what, and what the study can and cannot say.
Why the Study Was Run
The AI transformation is happening in code, not in keynotes.
Public repositories are the largest live record of how engineering actually works. Cursor adoption, Claude Code rollouts, agents replacing scripts. None of it stays hidden once commit history gets read at scale. The diff shows up in public before any blog post does.
The study set out to watch that transition in real time, quarter by quarter, on a single methodology. Before publishing any quarterly number, the methodology itself had to be on the table. Sample composition, scoring engine, decay factors, every limitation, every repository. Eight pages. 66 repositories enumerated by name in the appendix [2].
Why the Existing Metrics Failed
LOC. PR count. Story points. DORA.
Each answers a different question. None survive the one that matters: did the output get more valuable, or just more numerous?
A senior engineer who has been reading a repo for six months can tell. They watch what gets shipped, where it lands, and how dense the area was when it was touched. That is the signal. Nothing in the standard toolchain captures it.
The study built something that could.
Engineering Throughput Value
Engineering Throughput Value (ETV) is a unit of performance. It scores each merged commit by what changed, where it landed, and whether the work was real cognitive effort or mechanical busywork.
ETV is applied per file, per merged commit. Five factors:
- Complexity, the structural weight of the change itself
- Engagement, the ratio of surrounding code complexity to the complexity of the change, so a targeted edit in a dense area outscores a similar edit in trivial code
- Architecture, where the change lands in a feature graph derived from the repo; deeply connected features carry more weight than peripheral ones
- Decay, which cuts credit when the work is not real cognitive lift: mechanical refactors, self-rewrites of yesterday’s code, copy-paste from elsewhere in the repo
- Multiplier, which amplifies fixes when the bug was costly: old code, unfamiliar code, high-churn areas
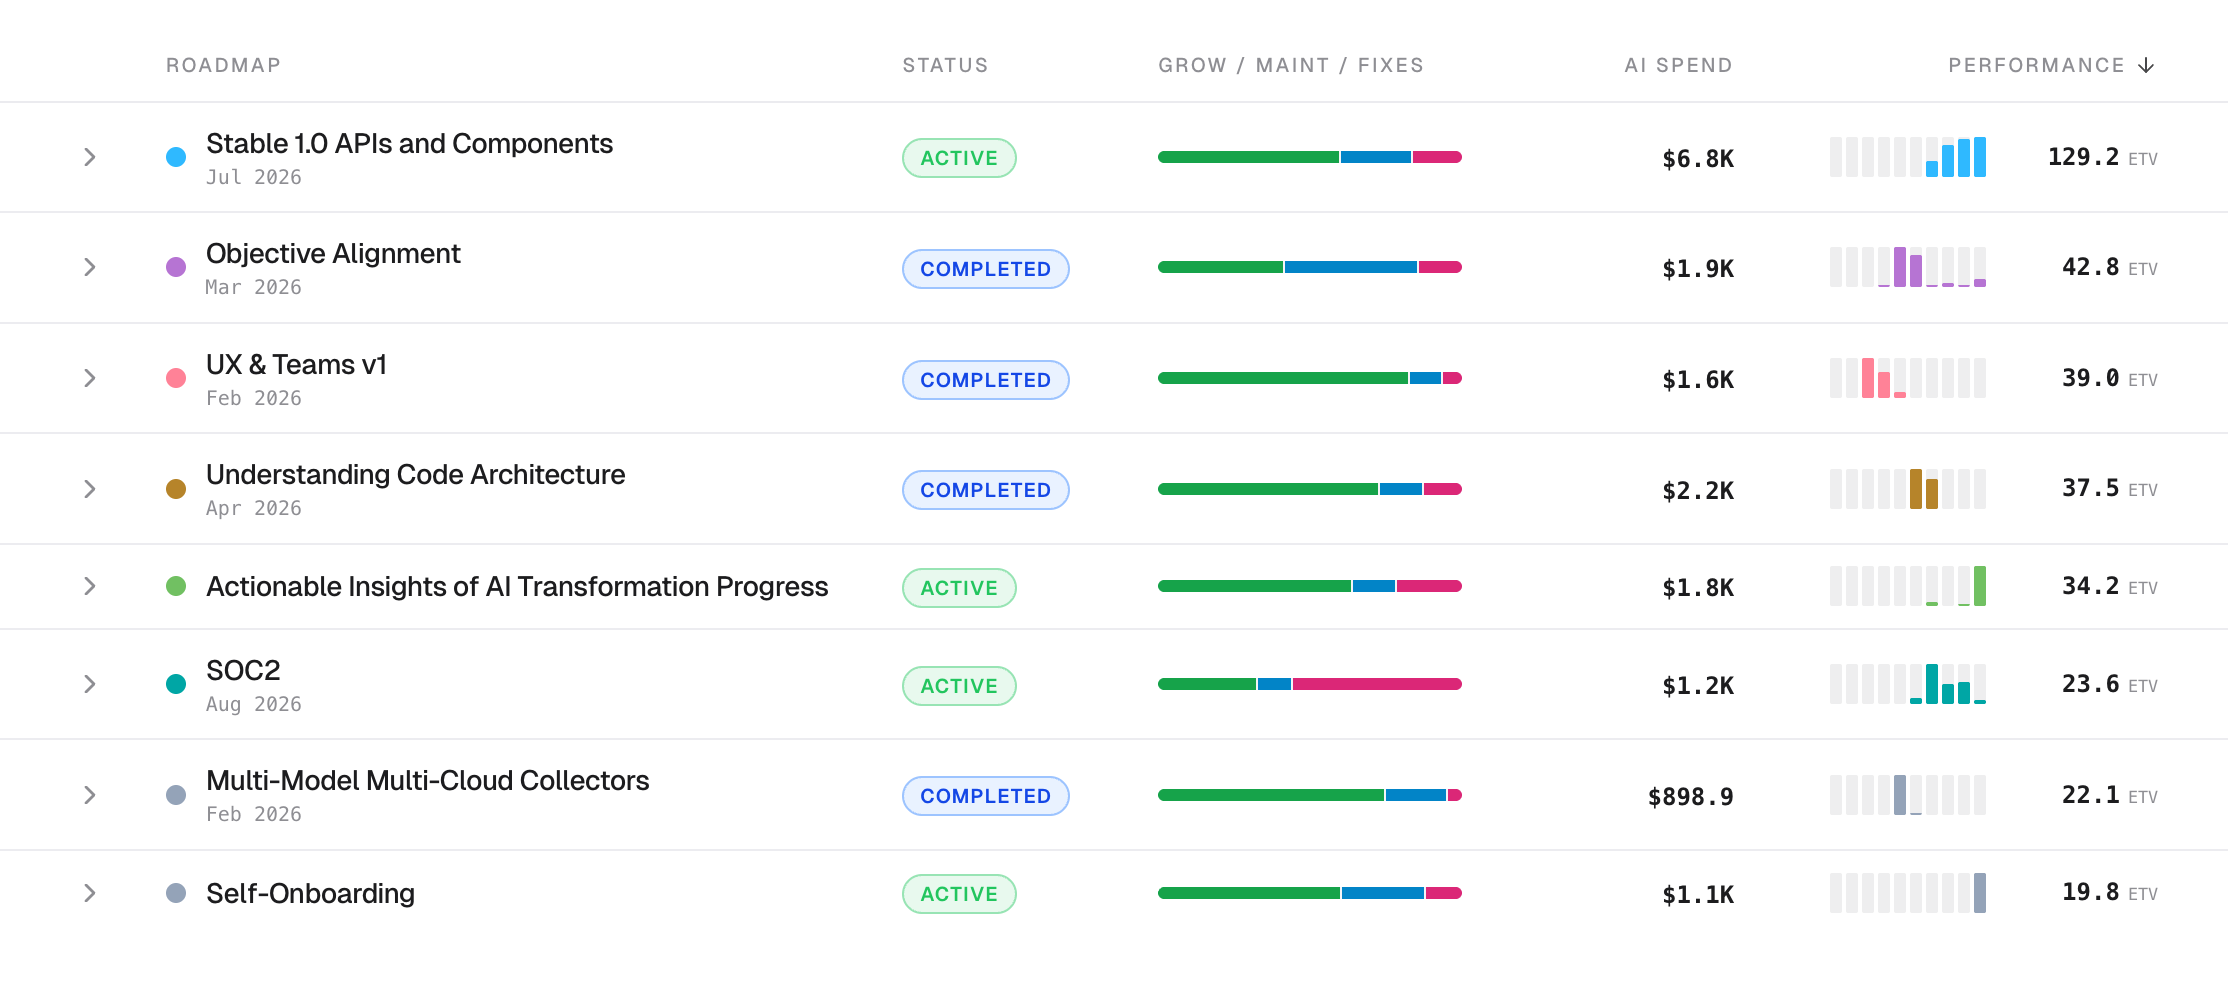
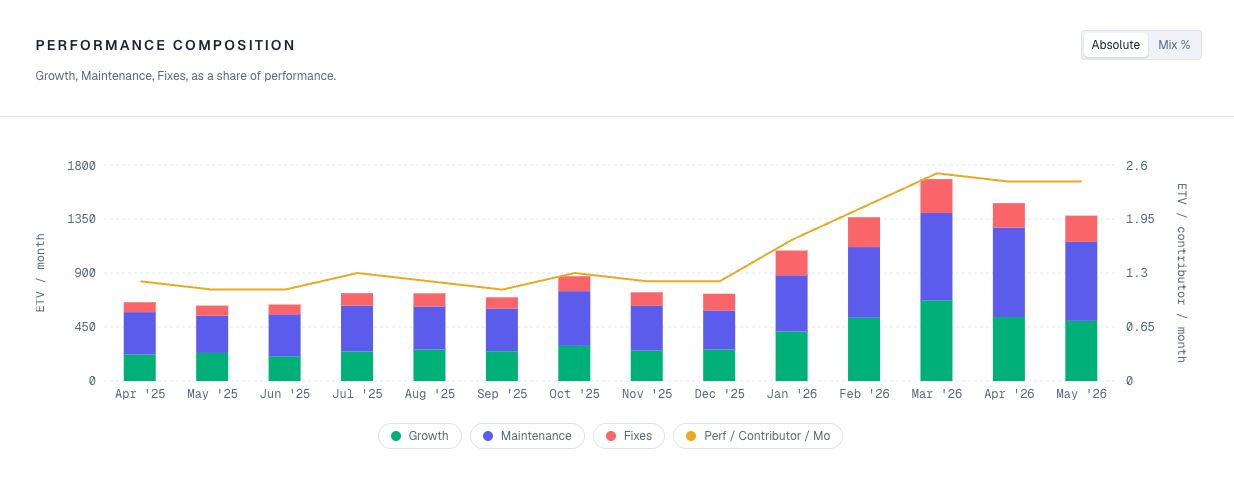
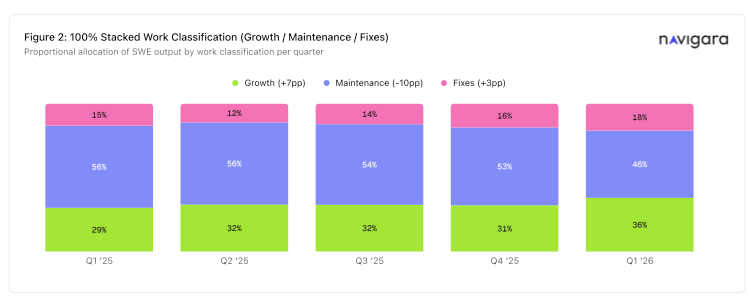
Every file rolls into one of three buckets: Growth, Maintenance, or Fixes. The buckets stay separate, on purpose. Two engineers with identical totals can be doing very different work, and the score will show it.
ETV reads from commit history alone. No project management tools, no surveys, no self-report. The repository already holds the answer.
How the Engine Works
Two stages.
First, a large language model reads the repo and tells the story behind each commit. What changed, why it likely changed, how it fits into what came before.
The first version of the engine used the model as a judge instead. Score distributions came back nearly flat. Everyone looked roughly the same. LLMs turn out to be poor judges of code work, even with structured prompts. So the role got flipped. The model became the storyteller, not the scorer.
Second, a deterministic engine takes that structured input and assigns the weight. The same diff produces the same score on every run. Machine learning tunes thresholds and coefficients inside that structure. The structure itself does not move.
Before any of that runs, a filter strips generated code, lockfiles, build artifacts, minified files, and binaries. Same filter across all six organizations.
What Was Run Against
The engine was not pointed at random GitHub.
Small repositories with one developer vibe-coding a side project tell you nothing about engineering at scale. The signal would be noise. The study drew a hard line on which codebases counted.
66 serious repositories made the cut. Codebases most engineers have used, depended on, or shipped against:
- microsoft/vscode, microsoft/TypeScript, microsoft/playwright, microsoft/PowerToys, microsoft/terminal, microsoft/FluidFramework
- facebook/react, facebook/react-native, facebook/folly, facebook/hermes, facebook/buck2, facebook/fbthrift
- google/perfetto, google/syzkaller, google/skia, google/flatbuffers
- vercel/next.js, vercel/turborepo, vercel/ai, vercel/swr
- openai/codex, openai/openai-python, openai/openai-agents-python, openai/openai-node
- cloudflare/workerd, cloudflare/pingora, cloudflare/cloudflared, cloudflare/workers-sdk
Full list of 66 in Appendix A of the white paper [1].
These are infrastructure. The kind of code where a careless commit breaks something downstream for thousands of teams. That sets the floor on quality, on review discipline, and on the size of the audience watching. It also keeps the cross-org comparison honest: every organization in the sample is shipping into the same kind of pressure.
What Five Quarters of Commit Data Showed
+116% performance per engineer, year over year.
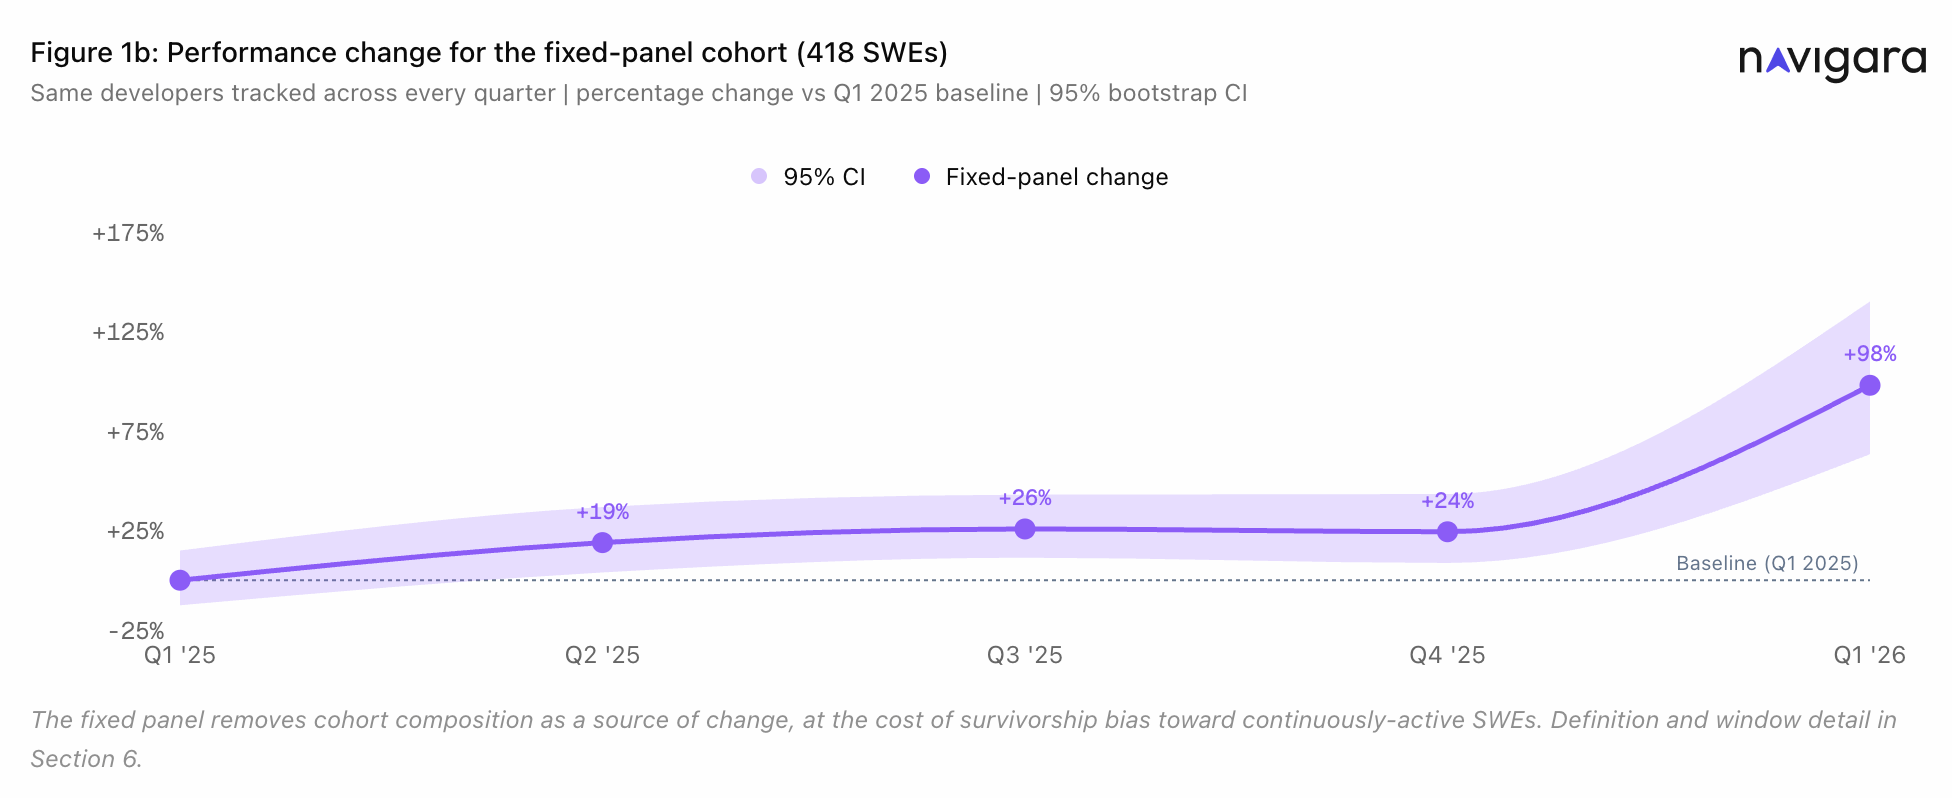
The obvious explanation got checked first. Was it just new contributors inflating the average? No. The fixed panel of 418 engineers active every quarter still moved +98%.
Three more numbers worth knowing:
- Per-commit intensity rose +51%. Commits per engineer rose +35%. The size of each commit moved more than the frequency of work
- Growth-classified output gained +7pp of share. Maintenance dropped -10pp. Fixes moved +3pp. Engineers shifted toward building new things, not putting out more fires
- The trajectory was +0%, +9%, +18%, +25%, +116%. Steady single digits through 2025, then an inflection in Q1 2026
The Slope Itself Changed
The trajectory looks small until you draw the line through the first four quarters.
+0%, +9%, +18%, +25%. That is roughly linear. Each quarter through 2025 added about eight percentage points to the previous one. A ruler held against those four points predicts Q1 2026 lands somewhere near +33%.
Q1 2026 landed at +116%.
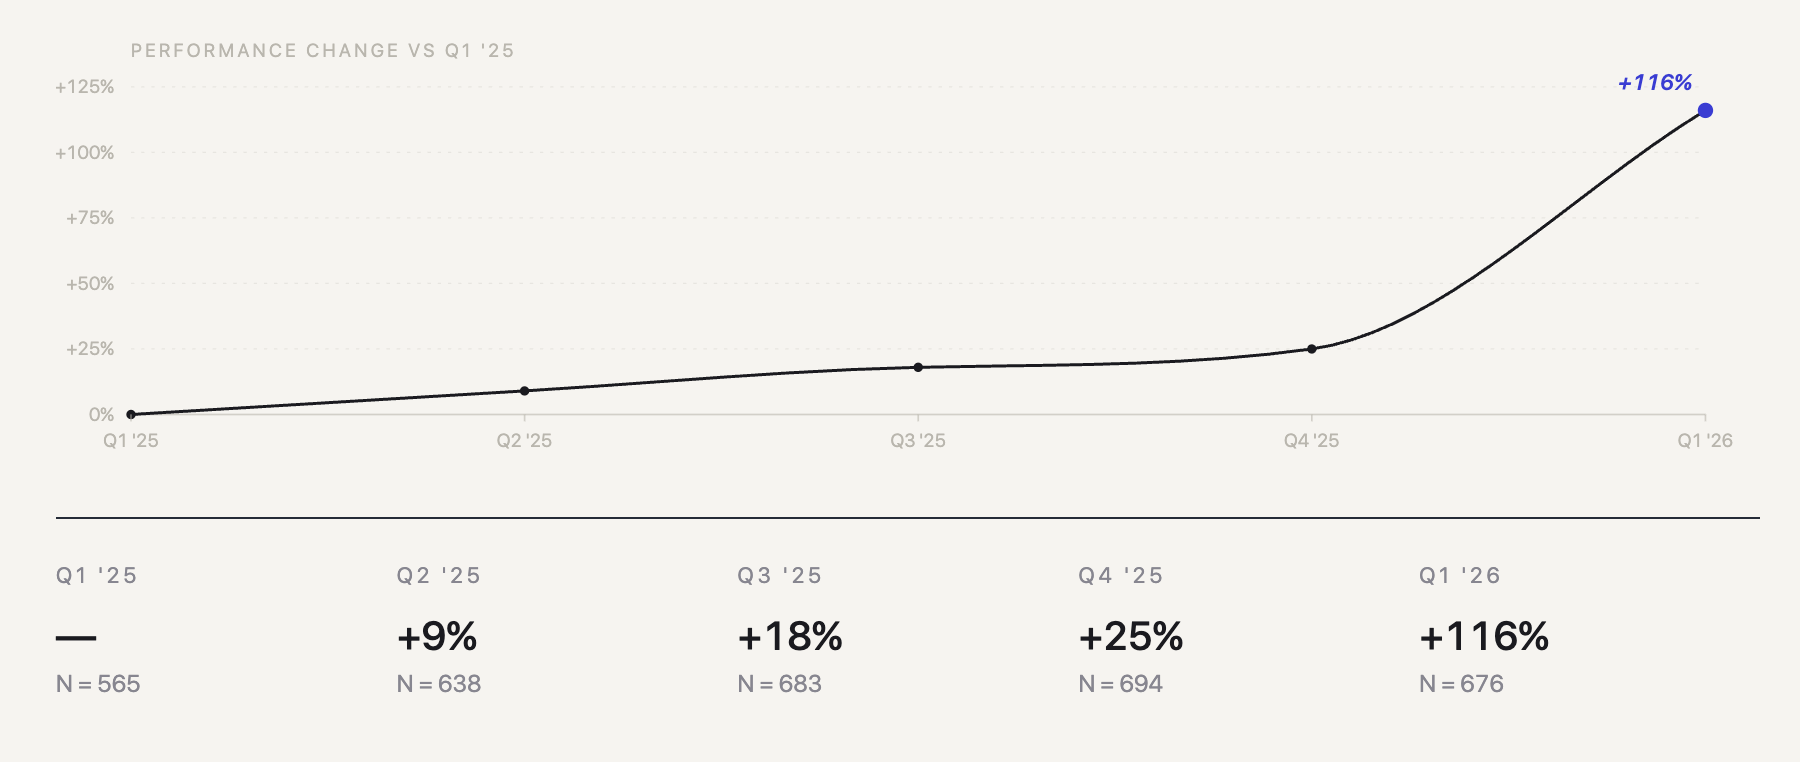
That is not acceleration of the existing trend. The previous trend, projected forward, expected another eight-point step. What arrived was 91 points. The line stopped behaving like the line.
This is the part that matters more than the headline number. Engineers get faster every year. Tools improve. The interesting question is never “did output rise” but “did the rate of change itself change.” For four quarters, the answer was no. In Q1 2026, the answer became yes.
One inflection is not proof of an exponential curve. It could be a genuine exponential, where Q2 2026 lands somewhere north of +250%. It could be a step-function shock, where AI tooling finished its first major adoption wave and the slope flattens back from a new baseline. It could be an overshoot that mean-reverts toward the prior trend.
The forecasting model that worked for the first four quarters cannot tell you which one. Q2 2026 can.
Six Companies, Six Different Slopes
The headline averages engineers, not companies. Underneath, the spread is wide:
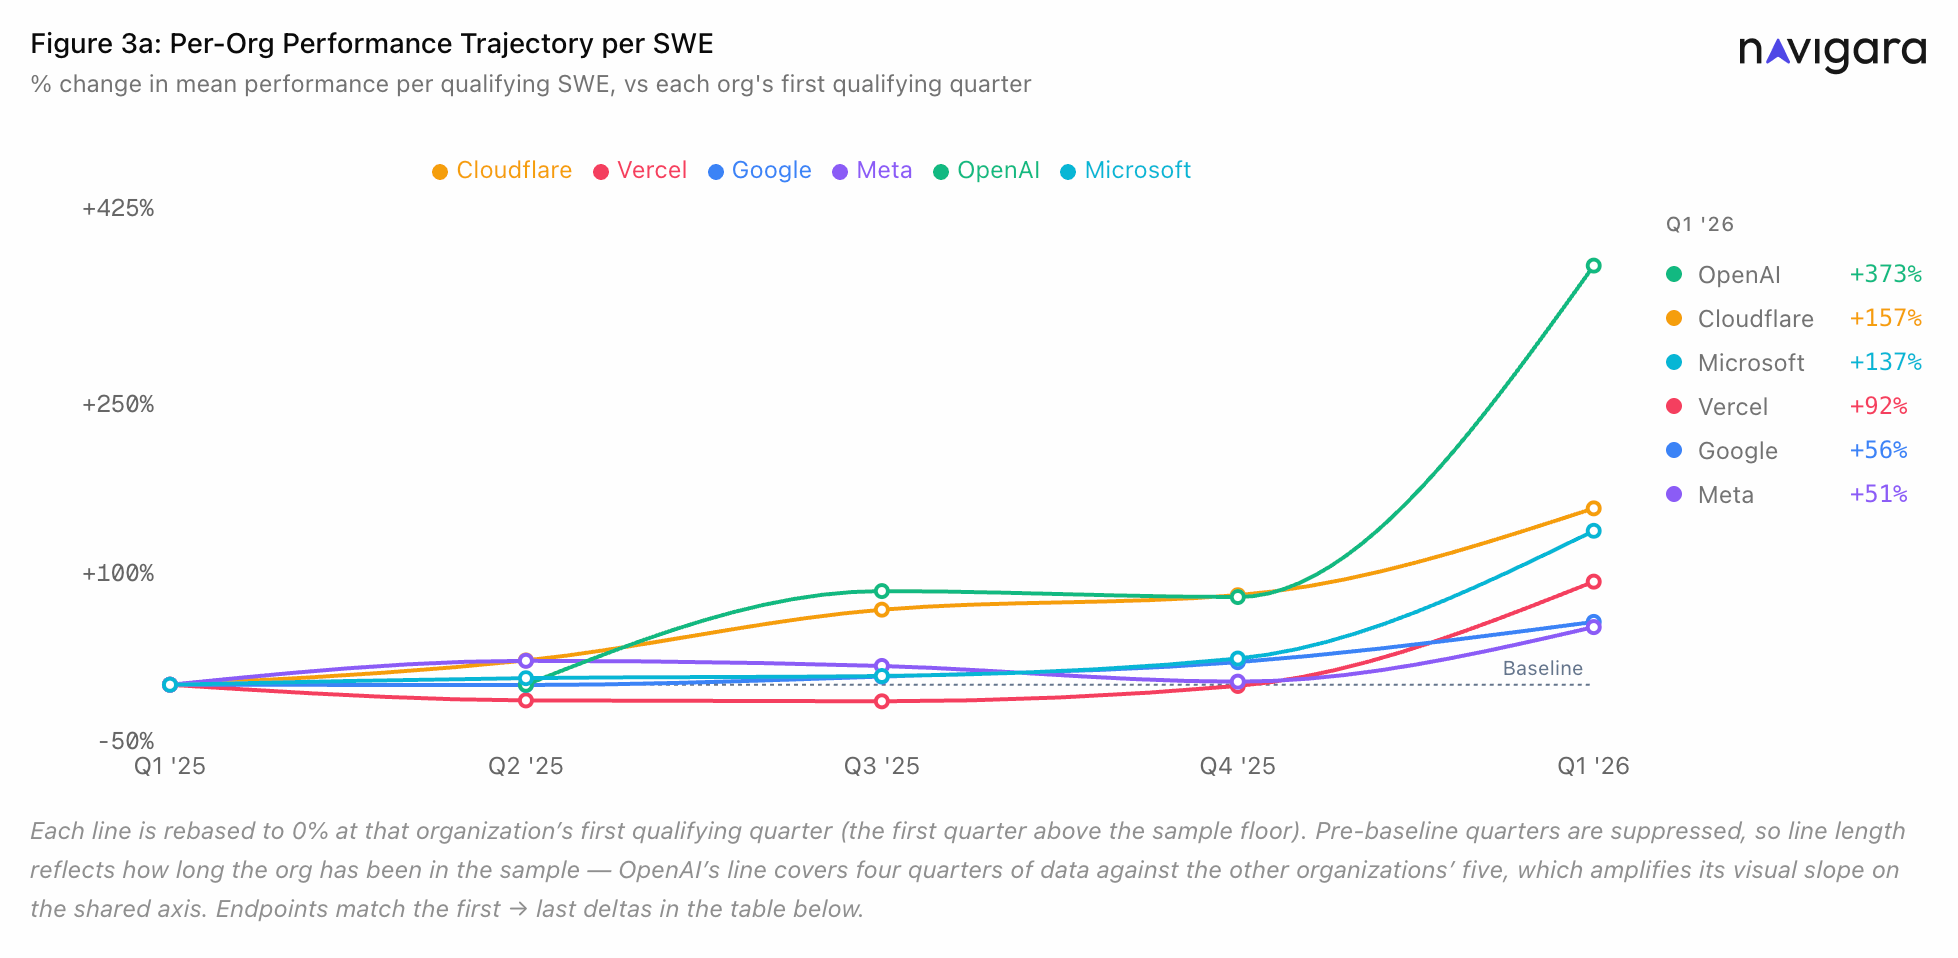
- OpenAI +373%, cohort entered Q2 ’25, read it as a ramp not a baseline
- Cloudflare +157%
- Microsoft +137%
- Vercel +92%
- Google +56%
- Meta +51%
Two patterns worth flagging. Neither is proof of anything.
The AI-forward sample (Cloudflare, Vercel, OpenAI) moved more than the incumbents (Google, Meta, Microsoft). Directionally consistent with the AI-adoption hypothesis. Not the same as confirming it.
Cohort size and movement are inversely correlated. Smaller orgs moved more. Could be AI. Could be sample mechanics. Could be both.
What This Study Did Not Measure
A few honest constraints:
- ETV measures what shipped. It does not measure whether what shipped was what the team planned to ship. Answering that needs a live connection to Jira or Linear, and a model that maps engineering output back to quarterly goals. That is a separate paper
- Cross-org comparisons are descriptive, not normative. Monorepo vs polyrepo, squash policy, and team structure are not controlled
- AI-assisted commits are attributed to the human GitHub identity. The share of any single diff written without help is not visible to the engine
The study makes descriptive and correlational claims only. Full sample composition and limitations live in Section 6 and Appendix A of the white paper [1].
What Q2 2026 Has to Settle
Q2 2026 will tell whether the inflection holds, decays, or accelerates.
Underneath that question is a bigger one. Two years from now, will engineering teams still be mostly humans with AI helping? Or mostly agents with humans reviewing? Public repositories are the only dataset large enough to answer. The next edition of the report will run the same engine, on the same axis, with the same caveats, against the next quarter of commits.
The Question That Actually Matters This Year
Every quarter of this transition looks different from the last.
Q1 2025 was a 0% baseline. Q4 2025 was +25%. Q1 2026 was +116%. The slope is not stable. The tooling is not stable. The way any engineering team writes code today is not the way they wrote it three months ago, and it will not be the way they write it three months from now.
In an environment that volatile, knowing where a team stands is the entire game.
Is the team shipping more this quarter than last? At what intensity? Toward growth, or toward maintenance? How does that compare to engineers at OpenAI, Vercel, and Microsoft, who are shipping into the same conditions?
Every CTO is going to face a version of one question in their next board meeting. Is this team winning the transition, or losing it?
Without measurement, that question stays a feeling.
References
[1] Navigara, “The Open Source Engineering Performance Report — Q1 2025 to Q1 2026,” white paper, 2026. [Online]. Available: https://research.navigara.com/research/Navigara-Performance-Report-Q1-2026.pdf
[2] Navigara, “Methodology — How Navigara Measures Engineering Throughput,” 2026. [Online]. Available: https://research.navigara.com/methodology